Honeywell 2013 Annual Report Download - page 128
Download and view the complete annual report
Please find page 128 of the 2013 Honeywell annual report below. You can navigate through the pages in the report by either clicking on the pages listed below, or by using the keyword search tool below to find specific information within the annual report.-
 1
1 -
2
-
3
-
4
-
5
-
6
-
7
-
8
-
9
-
10
-
11
-
12
-
13
-
14
-
15
-
16
-
17
-
18
-
19
-
20
-
21
-
22
-
23
-
24
-
25
-
26
-
27
-
28
-
29
-
30
-
31
-
32
-
33
-
34
-
35
-
36
-
37
-
38
-
39
-
40
-
41
-
42
-
43
-
44
-
45
-
46
-
47
-
48
-
49
-
50
-
51
-
52
-
53
-
54
-
55
-
56
-
57
-
58
-
59
-
60
-
61
-
62
-
63
-
64
-
65
-
66
-
67
-
68
-
69
-
70
-
71
-
72
-
73
-
74
-
75
-
76
-
77
-
78
-
79
-
80
-
81
-
82
-
83
-
84
-
85
-
86
-
87
-
88
-
89
-
90
-
91
-
92
-
93
-
94
-
95
-
96
-
97
-
98
-
99
-
100
-
101
-
102
-
103
-
104
-
105
-
106
-
107
-
108
-
109
-
110
-
111
-
112
-
113
-
114
-
115
-
116
-
117
-
 118
118 -
 119
119 -
 120
120 -
 121
121 -
 122
122 -
 123
123 -
 124
124 -
 125
125 -
 126
126 -
 127
127 -
 128
128 -
 129
129 -
 130
130 -
 131
131 -
 132
132 -
 133
133 -
 134
134 -
 135
135 -
 136
136 -
 137
137 -
 138
138 -
139
-
140
-
141
-
142
-
143
-
144
-
145
-
146
 |
 |

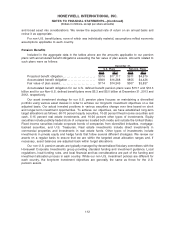
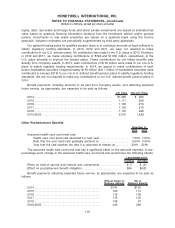
equity, debt, real estate and hedge funds and direct private investments are valued at estimated fair
value based on quarterly financial information received from the investment advisor and/or general
partner. Investments in real estate properties are valued on a quarterly basis using the income
approach. Valuation estimates are periodically supplemented by third party appraisals.
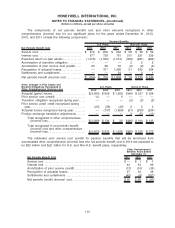
Our general funding policy for qualified pension plans is to contribute amounts at least sufficient to
satisfy regulatory funding standards. In 2013, 2012 and 2011, we were not required to make
contributions to our U.S. pension plans. No contribution was made to the U.S. plans in 2013. However,
in 2012 and 2011, we made voluntary contributions of $792 and $1,650 million, respectively, to the
U.S. plans primarily to improve the funded status. These contributions do not reflect benefits paid
directly from Company assets. In 2013, cash contributions of $156 million were made to our non-U.S.
plans to satisfy regularly funding requirements. In 2014, we expect to make contributions of cash
and/or marketable securities of approximately $150 million ($117 million of marketable securities were
contributed in January 2014) to our non-U.S. defined benefit pension plans to satisfy regulatory funding
standards. We are not required to make any contributions to our U.S. defined benefit pension plans in
2014.
Benefit payments, including amounts to be paid from Company assets, and reflecting expected
future service, as appropriate, are expected to be paid as follows:
U.S. Plans Non-U.S. Plans
2014. . . . . . . . . . . . . . . . . . . . . . . . . . . . . . . . . . . . . . . . . . . . . . . . . . . . . . . . . . $1,068 $ 202
2015. . . . . . . . . . . . . . . . . . . . . . . . . . . . . . . . . . . . . . . . . . . . . . . . . . . . . . . . . . 1,111 208
2016. . . . . . . . . . . . . . . . . . . . . . . . . . . . . . . . . . . . . . . . . . . . . . . . . . . . . . . . . . 1,106 213
2017. . . . . . . . . . . . . . . . . . . . . . . . . . . . . . . . . . . . . . . . . . . . . . . . . . . . . . . . . . 1,105 219
2018. . . . . . . . . . . . . . . . . . . . . . . . . . . . . . . . . . . . . . . . . . . . . . . . . . . . . . . . . . 1,118 226
2019-2023 . . . . . . . . . . . . . . . . . . . . . . . . . . . . . . . . . . . . . . . . . . . . . . . . . . . . 5,675 1,228
Other Postretirement Benefits
2013 2012
December 31,
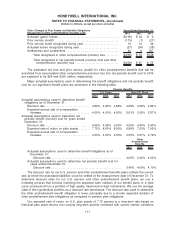
Assumed health care cost trend rate:
Health care cost trend rate assumed for next year . . . . . . . . . . . . . . . . . . . . . 7.00% 7.00%
Rate that the cost trend rate gradually declines to. . . . . . . . . . . . . . . . . . . . . . 5.00% 5.00%
Year that the rate reaches the rate it is assumed to remain at. . . . . . . . . . 2019 2019
The assumed health care cost trend rate has a significant effect on the amounts reported. A one-
percentage-point change in the assumed health care cost trend rate would have the following effects:
Increase Decrease
1 percentage point
Effect on total of service and interest cost components . . . . . . . . . . . . . . . . $ 3 $ (2)
Effect on postretirement benefit obligation . . . . . . . . . . . . . . . . . . . . . . . . . . . . . $84 $(52)
Benefit payments reflecting expected future service, as appropriate, are expected to be paid as
follows:
Without Impact of
Medicare Subsidy
Net of
Medicare Subsidy
2014 . . . . . . . . . . . . . . . . . . . . . . . . . . . . . . . . . . . . . . . . . . . . . . . . . $141 $130
2015 . . . . . . . . . . . . . . . . . . . . . . . . . . . . . . . . . . . . . . . . . . . . . . . . . 123 113
2016 . . . . . . . . . . . . . . . . . . . . . . . . . . . . . . . . . . . . . . . . . . . . . . . . . 119 108
2017 . . . . . . . . . . . . . . . . . . . . . . . . . . . . . . . . . . . . . . . . . . . . . . . . . 113 103
2018 . . . . . . . . . . . . . . . . . . . . . . . . . . . . . . . . . . . . . . . . . . . . . . . . . 108 97
2019-2023. . . . . . . . . . . . . . . . . . . . . . . . . . . . . . . . . . . . . . . . . . . . 448 399
116
HONEYWELL INTERNATIONAL INC.
NOTES TO FINANCIAL STATEMENTS—(Continued)
(Dollars in millions, except per share amounts)