Foot Locker 2003 Annual Report Download - page 3
Download and view the complete annual report
Please find page 3 of the 2003 Foot Locker annual report below. You can navigate through the pages in the report by either clicking on the pages listed below, or by using the keyword search tool below to find specific information within the annual report.-
 1
1 -
 2
2 -
 3
3 -
 4
4 -
 5
5 -
 6
6 -
 7
7 -
 8
8 -
 9
9 -
 10
10 -
 11
11 -
 12
12 -
 13
13 -
 14
14 -
15
-
16
-
17
-
18
-
19
-
20
-
21
-
22
-
23
-
24
-
25
-
26
-
27
-
28
-
29
-
30
-
31
-
32
-
33
-
34
-
35
-
36
-
37
-
38
-
39
-
40
-
41
-
42
-
43
-
44
-
45
-
46
-
47
-
48
-
49
-
50
-
51
-
52
-
53
-
54
-
55
-
56
-
57
-
58
-
59
-
60
-
61
-
62
-
63
-
64
-
65
-
66
-
67
-
68
-
69
-
70
-
71
-
72
-
73
-
74
-
75
-
76
-
77
-
78
-
79
-
80
-
81
-
82
-
83
-
84
 |
 |

1
SHAREHOLDERS’LETTER
Since the commencement of the new
millennium, our financial results have
consistently improved on a quarter-over-
quarter and year-over-year comparative
basis, and, I am pleased to say that in
2003 we continued Foot Locker, Inc.’s
strong track record of producing mean-
ingful earnings growth and a further
strengthening of our financial position.
Moreover, our near-term and longer-term
prospects are promising and we believe
that we are just beginning to hit our
stride.
Our significant accomplishments over
the past four years are attributable to
the hard work and dedication of our
40,000 worldwide associates. We have
built a results-oriented culture within a
highly disciplined organization that is
focused on improving returns for our
shareholders. While we are highly
encouraged by our recent progress, we
remain focused on continuing to raise
the bar for ourselves. We are committed
to enhancing shareholder value by driv-
ing continued earnings per share growth
and by using the cash that we are gen-
erating to both reinvest in our business
and to pay cash dividends to our share-
holders.
2003 Financial Highlights
2003 was a significant year for us.
We reported strong growth in earnings
and cash flow, and also better posi-
tioned ourselves to continue to report
further gains in the future. Every year is
filled with distinct challenges as well as
unique opportunities, and 2003 was no
exception. First, however, let’s review
our financial results:
• Total sales increased 6.0 percent to
$4.8 billion.
• Operating profit margin expanded to
7.2 percent from 6.0 percent.
• Earnings per share grew by 27
percent to $1.40 from $1.10.
• Return on equity improved to 16.8
percent from 15.4 percent.
• Total cash, net of debt increased
by $112 million.
Identifying Emerging
Fashion Trends Early
As we entered 2003, our stores in the
United States faced several unfavorable
trends that put pressure on comparable-
store sales. These trends included a
fashion-shift to lower-priced classic
footwear, declining customer traffic in
shopping malls, weak consumer confi-
dence and a highly promotional retail
environment. Yet, despite the overall
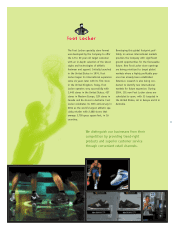
retailing environment, we succeeded by
differentiating our businesses from the
competition by identifying emerging
fashion trends early and working closely
with our suppliers to develop new and
exclusive products for our customers.
Growth At Home And Abroad
The balance we are building into our
business model is an important factor
that has contributed to our impressive
financial performance. Namely, we are
growing our business both at home and
abroad. In fact, our most significant
sales and profit growth were generated
by our stores operating in international
regions. Europe, where we currently
operate 427 stores, generated a 40 per-
cent increase in total sales and produced
record profits during 2003. We have tar-
geted this market as a significant oppor-
tunity for profitable growth over the
next several years. In total, our athletic
store segment sales grew by 6.1 percent
and, more importantly, division profit
increased 30 percent.
The successful implementation of strategic initiatives
has contributed to our significantly improved profitability,
strong cash flow and solid balance sheet.
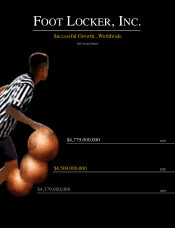
Financial Highlights
(Millions, except per share amounts)
2003 2002 2001
Sales $ 4,779 $ 4,509 $ 4,379
Total operating profit $ 342 $ 269 $ 197
Income from continuing operations $ 209 $ 162 $ 111
Diluted EPS from continuing operations $ 1.40 $ 1.10 $ 0.77
Cash, net of debt $ 112 $ --- $ (184)