Foot Locker 2003 Annual Report Download - page 2
Download and view the complete annual report
Please find page 2 of the 2003 Foot Locker annual report below. You can navigate through the pages in the report by either clicking on the pages listed below, or by using the keyword search tool below to find specific information within the annual report.-
 1
1 -
 2
2 -
 3
3 -
 4
4 -
 5
5 -
 6
6 -
 7
7 -
 8
8 -
 9
9 -
 10
10 -
 11
11 -
 12
12 -
 13
13 -
14
-
15
-
16
-
17
-
18
-
19
-
20
-
21
-
22
-
23
-
24
-
25
-
26
-
27
-
28
-
29
-
30
-
31
-
32
-
33
-
34
-
35
-
36
-
37
-
38
-
39
-
40
-
41
-
42
-
43
-
44
-
45
-
46
-
47
-
48
-
49
-
50
-
51
-
52
-
53
-
54
-
55
-
56
-
57
-
58
-
59
-
60
-
61
-
62
-
63
-
64
-
65
-
66
-
67
-
68
-
69
-
70
-
71
-
72
-
73
-
74
-
75
-
76
-
77
-
78
-
79
-
80
-
81
-
82
-
83
-
84
 |
 |

Athletic Stores Sales Per Average Gross Square Foot
(dollars)
About the Company
Foot Locker, Inc. (NYSE: FL) is the world's leading
retailer of athletic footwear and apparel. Headquartered
in New York City, it operates approximately 3,600 athlet-
ic retail stores in 16 countries in North America, Europe
and Australia under the brand names Foot Locker,
Lady Foot Locker, Kids Foot Locker and Champs Sports.
Additionally, the Company's Footlocker.com/Eastbay
business operates a rapidly growing direct-to-customers
business offering athletic footwear, apparel and equip-
ment through its Internet and catalog channels.
Table of Contents
Shareholders’ Letter 1Business Overview 4Foot Locker 5Champs Sports 6Lady Foot Locker/Kids Foot Locker 7Footlocker.com/Eastbay 8
Form 10-K 9Board of Directors, Corporate Management, Division Management, Corporate Information IBC
Income from Continuing Operations
(millions)
$306
$301
$282
$316
$335
Operating Profit Margin
(percent)
ROE
(percent)
2003
2002
2001
2000
1999
4.5%
4.2%
6.0%
7.2%
2003
2002
2001
2000
1999
$111
$107
$162
$209
2003
2002
2001
2000
1999
11.1%
10.0%
5.4%
15.4%
16.8%
2003
2002
2001
2000
1999
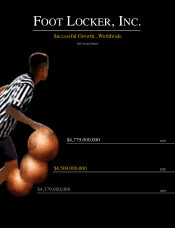
Cover image illustrates sales growth.
FOOT LOCKER, INC.
$59
-1.8%