Food Lion 2008 Annual Report Download - page 86
Download and view the complete annual report
Please find page 86 of the 2008 Food Lion annual report below. You can navigate through the pages in the report by either clicking on the pages listed below, or by using the keyword search tool below to find specific information within the annual report.-
 1
1 -
2
-
3
-
4
-
5
-
6
-
7
-
8
-
9
-
10
-
11
-
12
-
13
-
14
-
15
-
16
-
17
-
18
-
19
-
20
-
21
-
22
-
23
-
24
-
25
-
26
-
27
-
28
-
29
-
30
-
31
-
32
-
33
-
34
-
35
-
36
-
37
-
38
-
39
-
40
-
41
-
42
-
43
-
44
-
45
-
46
-
47
-
48
-
49
-
50
-
51
-
52
-
53
-
54
-
55
-
56
-
57
-
58
-
59
-
60
-
61
-
62
-
63
-
64
-
65
-
66
-
67
-
68
-
69
-
70
-
71
-
72
-
73
-
74
-
75
-
 76
76 -
 77
77 -
 78
78 -
 79
79 -
 80
80 -
 81
81 -
 82
82 -
 83
83 -
 84
84 -
 85
85 -
 86
86 -
 87
87 -
 88
88 -
 89
89 -
 90
90 -
 91
91 -
 92
92 -
 93
93 -
 94
94 -
 95
95 -
 96
96 -
97
-
98
-
99
-
100
-
101
-
102
-
103
-
104
-
105
-
106
-
107
-
108
-
109
-
110
-
111
-
112
-
113
-
114
-
115
-
116
-
117
-
118
-
119
-
120
-
121
-
122
-
123
-
124
-
125
-
126
-
127
-
128
-
129
-
130
-
131
-
132
-
133
-
134
-
135
 |
 |

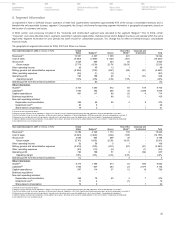
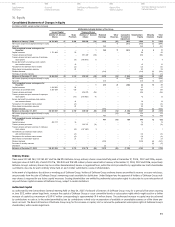
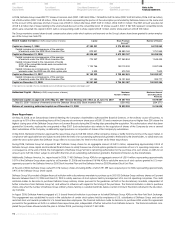
Year ended December 31, 2006 (in millions of EUR) United Rest of the Corporate and
States Belgium
(2)
Greece World
(3)
Unallocated Total
Revenues(1) 13 773 4 275 1 030 137 - 19 215
Cost of sales (10 024) (3 430) (801) (112) - (14 367)
Gross profit 3 749 845 229 25 - 4 848
Gross margin 27.2% 19.8% 22.2% 18.1% - 25.2%
Other operating income 40 37 5 1 - 83
Selling, general and administrative expenses (3 009) (703) (200) (25) (28) (3 965)
Other operating expenses (15) (3) (1) - - (19)
Operating profit 765 176 33 1 (28) 947
Operating margin 5.6% 4.1% 3.2% 0.2% - 4.9%
Operating profit from discontinued operations (2) - - (62) - (64)
Other information
Assets(4) 6 660 1 548 383 33 671 9 295
Liabilities(5) 1 139 883 243 19 3 450 5 734
Capital expenditures 528 107 38 12 15 700
Business acquisitions - - - - - -
Non-cash operating activities:
Depreciation and amortization 394 76 19 10 4 503
Impairment loss(6) 1 1 1 65 - 68
Share-based compensation 20 2 - - 1 23
(1) All revenues are from external parties.
(2) Belgium includes Delhaize Group’s operations in Belgium, the Grand-Duchy of Luxembourg and Germany (the latter reported in discontinued operations (see Note 5).
(3) Rest of the World include the Group’s operations in Romania and Indonesia. Operations in the Czech Republic and Slovakia are presented in discontinued operations (see Note 5).
(4) Segment assets exclude cash and cash equivalents, financial assets, derivatives and income tax related assets, which are included in “Corporate and Unallocated.”
(5) Segment liabilities exclude financial liabilities including debt, finance leases, derivatives and income tax related liabilities, which are included in “Corporate and Unallocated.”
(6) No impairment loss was recorded in equity.
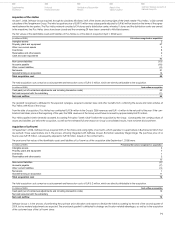
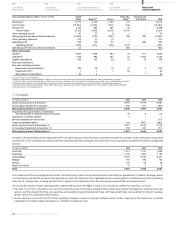
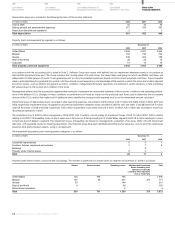
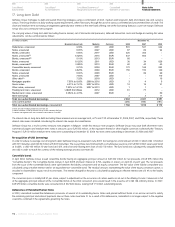
7. Goodwill
(in millions of EUR) 2008 2007 2006
Gross carrying amount at January 1 2 516 2 774 3 081
Accumulated impairment at January 1 (70) (77) (84)
Net carrying amount at January 1 2 446 2 697 2 997
Acquisitions through business combinations
and adjustments to initial purchase accounting 30 6 (2)
Acquisition of minority interest 7 - 1
Amount classified as held for sale - - (17)
Currency translation effect 124 (257) (282)
Gross carrying amount at December 31 2 677 2 516 2 774
Accumulated impairment at December 31 (70) (70) (77)
Net carrying amount at December 31 2 607 2 446 2 697
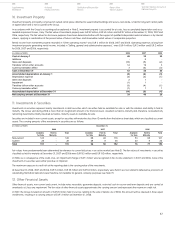
Goodwill is allocated and tested for impairment at the cash generating unit (CGU) level that is expected to benefit from synergies of the combination the goodwill
resulted from, which at Delhaize Group represents the operating entity level, being also the lowest level at which goodwill is monitored for internal management
purpose:
(in millions of EUR) 2008 2007 2006
Food Lion 1 213 1 147 1 282
Hannaford 1 103 1 043 1 159
United States 2 316 2 190 2 441
Belgium 160 160 160
Greece 120 94 94
Rest of the World 11 2 2
Total 2 607 2 446 2 697
In accordance with the accounting policies in Note 2, Delhaize Group conducts an annual impairment assessment for goodwill and, in addition, whenever events
or circumstances indicate that an impairment may have occurred. The impairment test of goodwill involves comparing the recoverable amount of each operating
entity with its carrying value, including goodwill and recognition of an impairment loss if the carrying value exceeds the recoverable amount.
The recoverable amount of each operating entity is determined based on the higher of value in use calculations and the fair value less cost to sell:
• Thevalueinuse(“VIU”)calculationsusecashflowprojectionsbasedonthelatestavailablefinancialplansapprovedbymanagementcoveringathree-year
period. Cash flows beyond the three-year period are extrapolated using estimated growth rates, with these growth rates not exceeding the long-term average
growth rate for the supermarket retail business.
• Thefairvaluelesscosttosell(“FVLCTS”)ofeachoperatingcompanyisbasedonearningsmultiplespaidforsimilarcompaniesinthemarketand/ormarket
capitalization for publicly traded subsidiaries (i.e. Alfa-Beta Vassilopoulos S.A.).
Consolidated
Balance Sheets
Consolidated
Income Statements
Consolidated Statements of
Recognized Income and Expense
Consolidated
Statements of Cash Flows
82 - Delhaize Group - Annual Report 2008
Notes to the
Financial Statements