Food Lion 2008 Annual Report Download - page 121
Download and view the complete annual report
Please find page 121 of the 2008 Food Lion annual report below. You can navigate through the pages in the report by either clicking on the pages listed below, or by using the keyword search tool below to find specific information within the annual report.-
 1
1 -
2
-
3
-
4
-
5
-
6
-
7
-
8
-
9
-
10
-
11
-
12
-
13
-
14
-
15
-
16
-
17
-
18
-
19
-
20
-
21
-
22
-
23
-
24
-
25
-
26
-
27
-
28
-
29
-
30
-
31
-
32
-
33
-
34
-
35
-
36
-
37
-
38
-
39
-
40
-
41
-
42
-
43
-
44
-
45
-
46
-
47
-
48
-
49
-
50
-
51
-
52
-
53
-
54
-
55
-
56
-
57
-
58
-
59
-
60
-
61
-
62
-
63
-
64
-
65
-
66
-
67
-
68
-
69
-
70
-
71
-
72
-
73
-
74
-
75
-
76
-
77
-
78
-
79
-
80
-
81
-
82
-
83
-
84
-
85
-
86
-
87
-
88
-
89
-
90
-
91
-
92
-
93
-
94
-
95
-
96
-
97
-
98
-
99
-
100
-
101
-
102
-
103
-
104
-
105
-
106
-
107
-
108
-
109
-
110
-
 111
111 -
 112
112 -
 113
113 -
 114
114 -
 115
115 -
 116
116 -
 117
117 -
 118
118 -
 119
119 -
 120
120 -
 121
121 -
 122
122 -
 123
123 -
 124
124 -
 125
125 -
 126
126 -
 127
127 -
 128
128 -
 129
129 -
 130
130 -
 131
131 -
132
-
133
-
134
-
135
 |
 |

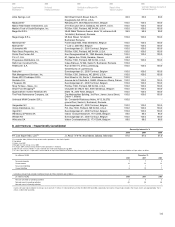
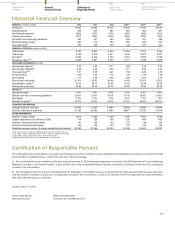
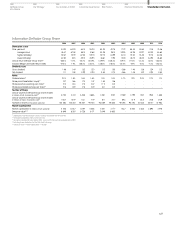
Number of Stores (at year-end)
2009
(1)
2008 2007 2006 2005 2004 2003 2002 2001 2000 1999
United States 1 605 - 1 610 1 594 1 570 1 549 1 537 1 523 1 515 1 485 1 459 1 420 1 276
Belgium and G.D. Luxembourg 800 - 805 771 734 840(2) 806 745 726 707 675 615 553
Greece 217 201 159 148 135 129 119 111 104 53 48
Romania 48 40 22 18 16 16 15 12 10 10 -
Indonesia 74 63 56 50 46 42 38 34 29 20 14
Subtotal 2 744 - 2 754 2 669 2 541 2 605 2 540 2 455 2 413 2 349 2 277 2 118 1 891
Divested and Discontinued Operations
Czech Republic - - - 97 94 97 94 93 94 99 99
Slovakia - - - - - 11 14 16 16 15 14
Thailand - - - - - - 36 34 26 18 13
Singapore - - - - - - - 35 31 30 25
Super Discount Markets (U.S.) - - - - - - - - - 30 20
France - - - - - - - - - - 50
Germany - 4 4 3 2 2 2 - - - -
Total 2 744 - 2 754 2 673 2 545 2 705 2 636 2 565 2 559 2 527 2 444 2 310 2 112
(1) Estimates based on planned openings and closings.
(2) Includes 132 Di stores sold in 2007.
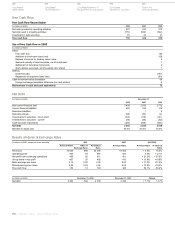
Number of Associates (at year-end)
2008 2007 2006
Full-time 64 400 62 570 64 726
Part-time 76 592 75 261 77 790
FTE 106 247 103 786 106 648
Male 69 774 68 044 69 137
Female 71 218 69 787 73 379
Total 140 992 137 831 142 516
Geographical Split
2008 2007 2006
Total FTE
(1)
Total FTE Total FTE
United States 108 808 78 782 107 920 78 076 108 883 77 965
Belgium 17 167 14 370 17 190 14 527 18 081(2) 15 348
Greece 8 821 6 930 7 545 6 016 7 209 5 764
Czech Republic - - - - 3 714 2 943
Romania 1 877 1 846 1 247 1 238 1 095 1 094
Indonesia 4 319 4 319 3 929 3 929 3 534 3 534
Total 140 992 106 247 137 831 103 786 142 516 106 648
(1) Full-time equivalent.
(2) Includes 492 associates working in company-operated Di stores sold in 2007.
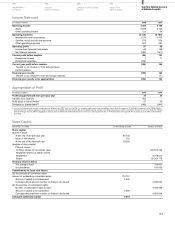
Organic Revenue Growth Reconciliation
(in millions of EUR) 2008 2007 % Change
Revenues 19 024 18 943 0.4%
Effect of exchange rates 980 -
Revenues at identical exchange rates 20 004 18 943 5.6%
Divestitures - (47)
Acquisitions (43) -
53rd sales week in the U.S. (277) -
Organic revenue growth 19 684 18 896 4.2%
117
Supplementary
Information
Certification of Responsible
Persons
Historical
Financial Overview
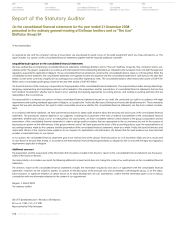
Report of the
Statutory Auditor
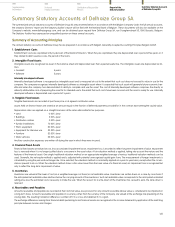
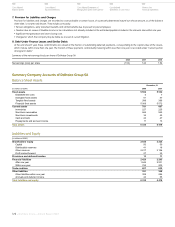
Summary Statutory Accounts of
Delhaize Group SA