Food Lion 2008 Annual Report Download - page 104
Download and view the complete annual report
Please find page 104 of the 2008 Food Lion annual report below. You can navigate through the pages in the report by either clicking on the pages listed below, or by using the keyword search tool below to find specific information within the annual report.-
 1
1 -
2
-
3
-
4
-
5
-
6
-
7
-
8
-
9
-
10
-
11
-
12
-
13
-
14
-
15
-
16
-
17
-
18
-
19
-
20
-
21
-
22
-
23
-
24
-
25
-
26
-
27
-
28
-
29
-
30
-
31
-
32
-
33
-
34
-
35
-
36
-
37
-
38
-
39
-
40
-
41
-
42
-
43
-
44
-
45
-
46
-
47
-
48
-
49
-
50
-
51
-
52
-
53
-
54
-
55
-
56
-
57
-
58
-
59
-
60
-
61
-
62
-
63
-
64
-
65
-
66
-
67
-
68
-
69
-
70
-
71
-
72
-
73
-
74
-
75
-
76
-
77
-
78
-
79
-
80
-
81
-
82
-
83
-
84
-
85
-
86
-
87
-
88
-
89
-
90
-
91
-
92
-
93
-
 94
94 -
 95
95 -
 96
96 -
 97
97 -
 98
98 -
 99
99 -
 100
100 -
 101
101 -
 102
102 -
 103
103 -
 104
104 -
 105
105 -
 106
106 -
 107
107 -
 108
108 -
 109
109 -
 110
110 -
 111
111 -
 112
112 -
 113
113 -
 114
114 -
115
-
116
-
117
-
118
-
119
-
120
-
121
-
122
-
123
-
124
-
125
-
126
-
127
-
128
-
129
-
130
-
131
-
132
-
133
-
134
-
135
 |
 |

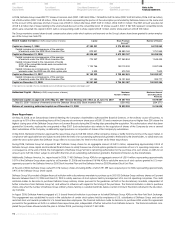
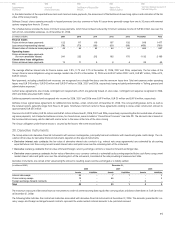
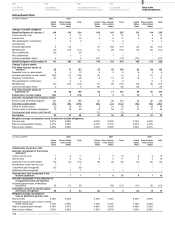
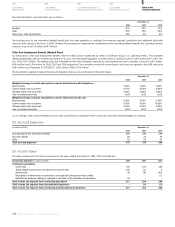
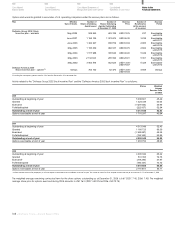
Defined Benefit Plans
(in millions of EUR) 2008 2007 2006
United Plans Outside Total United Plans Outside Total United Plans Outside Total
States of the United States of the United States of the United
Plans States Plans States Plans States
Change in benefit obligation:
Benefit obligation at January 1 104 110 214 109 116 225 121 114 235
Current service cost 7 4 11 7 5 12 8 5 13
Interest cost 6 6 12 6 5 11 6 4 10
Plan participants’ contributions - 2 2 - 2 2 - 2 2
Amendments - - - 1 - 1 - - -
Actuarial (gain)/loss 2 (2) - (1) (10) (11) (6) (4) (10)
Benefits paid (6) (15) (21) (7) (9) (16) (8) (5) (13)
Plan curtailments (8) - (8) - - - - - -
Plan settlements - 1 1 - 1 1 - - -
Currency translation effect 6 - 6 (11) - (11) (12) - (12)
Benefit obligation at December 31 111 106 217 104 110 214 109 116 225
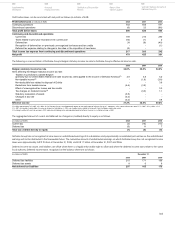
Change in plans assets:
Fair value of plans assets at
January 1 82 71 153 85 65 150 82 60 142
Expected return on plan assets 6 4 10 6 3 9 6 2 8
Actuarial gain/(loss) on plan assets (28) (1) (29) (1) - (1) 4 (1) 3
Employer contributions 21 8 29 8 10 18 10 7 17
Plan participants’ contributions - 2 2 - 2 2 - 2 2
Benefits paid (6) (15) (21) (7) (9) (16) (8) (5) (13)
Currency translation effect 4 - 4 (9) - (9) (9) - (9)
Fair value of plans assets at
December 31 79 69 148 82 71 153 85 65 150
Actual return on plan assets (22) 3 (19) 5 3 8 10 1 11
Amounts recognized in the balance sheet:
Present value of funded obligation 101 87 188 91 92 183 96 99 195
Fair Value of plan assets (79) (69) (148) (82) (71) (153) (85) (65) (150)
Deficit for funded plans 22 18 40 9 21 30 11 34 45
Present value of unfunded obligations 10 19 29 13 18 31 13 17 30
Unrecognized past service (cost) benefit - - - (1) - (1) - - -
Net liability 32 37 69 21 39 60 24 51 75
Weighted average assumptions used to determine benefit obligations:
Discount rate 6.01% 5.55% 6.00% 5.32% 5.75% 4.34%
Rate of compensation increase 4.67% 3.38% 4.76% 3.37% 4.60% 3.36%
Rate of price inflation 3.50% 2.09% 3.50% 2.08% 3.50% 2.07%
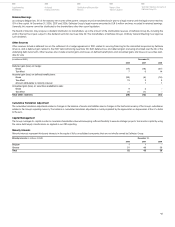
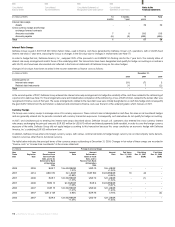
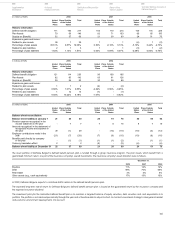
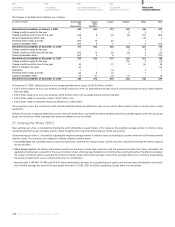
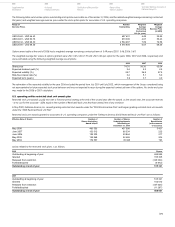
(in millions of EUR) 2008 2007 2006
United Plans Outside Total United Plans Outside Total United Plans Outside Total
States of the United States of the United States of the United
Plans States Plans States Plans States
Components of pension cost:
Amounts recognized in the income
statement:
Current service cost 7 4 11 7 5 12 8 5 13
Interest cost 6 6 12 6 5 11 6 4 10
Expected return on plan assets (6) (4) (10) (6) (3) (9) (6) (2) (8)
Amortization of past service cost 1 - 1 - - - - - -
Curtailment gain recognized (8) - (8) - - - - - -
Settlement loss recognized - 1 1 - 1 1 - - -
Total pension cost recognized in the
income statement - 7 7 7 8 15 8 7 15
Amounts recognized in the statement of
recognized income and expense:
Actuarial (gains)/losses immediately
recognized 30 (1) 29 - (10) (10) (10) (3) (13)
Cumulative amount of actuarial gains
and losses recognized 28 5 33 (2) 6 4 (2) 16 14
Weighted average assumptions
used to determine pension cost:
Discount rate 6.00% 5.32% 5.75% 4.34% 5.46% 3.65%
Expected long-term rate of return on plan
assets during year 7.75% 4.90% 7.75% 4.15% 7.75% 4.25%
Rate of compensation increase 4.76% 3.37% 4.60% 3.36% 4.59% 3.35%
Rate of price inflation 3.50% 2.08% 3.50% 2.07% 3.50% 2.06%
Consolidated
Balance Sheets
Consolidated
Income Statements
Consolidated Statements of
Recognized Income and Expense
Consolidated
Statements of Cash Flows
100 - Delhaize Group - Annual Report 2008
Notes to the
Financial Statements