Food Lion 2008 Annual Report Download - page 70
Download and view the complete annual report
Please find page 70 of the 2008 Food Lion annual report below. You can navigate through the pages in the report by either clicking on the pages listed below, or by using the keyword search tool below to find specific information within the annual report.-
 1
1 -
2
-
3
-
4
-
5
-
6
-
7
-
8
-
9
-
10
-
11
-
12
-
13
-
14
-
15
-
16
-
17
-
18
-
19
-
20
-
21
-
22
-
23
-
24
-
25
-
26
-
27
-
28
-
29
-
30
-
31
-
32
-
33
-
34
-
35
-
36
-
37
-
38
-
39
-
40
-
41
-
42
-
43
-
44
-
45
-
46
-
47
-
48
-
49
-
50
-
51
-
52
-
53
-
54
-
55
-
56
-
57
-
58
-
59
-
 60
60 -
 61
61 -
 62
62 -
 63
63 -
 64
64 -
 65
65 -
 66
66 -
 67
67 -
 68
68 -
 69
69 -
 70
70 -
 71
71 -
 72
72 -
 73
73 -
 74
74 -
 75
75 -
 76
76 -
 77
77 -
 78
78 -
 79
79 -
 80
80 -
81
-
82
-
83
-
84
-
85
-
86
-
87
-
88
-
89
-
90
-
91
-
92
-
93
-
94
-
95
-
96
-
97
-
98
-
99
-
100
-
101
-
102
-
103
-
104
-
105
-
106
-
107
-
108
-
109
-
110
-
111
-
112
-
113
-
114
-
115
-
116
-
117
-
118
-
119
-
120
-
121
-
122
-
123
-
124
-
125
-
126
-
127
-
128
-
129
-
130
-
131
-
132
-
133
-
134
-
135
 |
 |

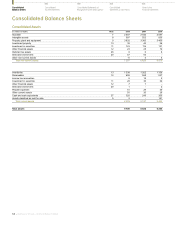
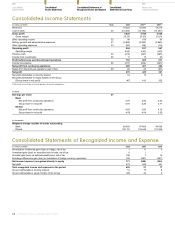
Consolidated Income Statements
(in millions of EUR) Note 2008 2007
(1)
2006
(1)
Revenues 19 024 18 943 19 215
Cost of sales 30 (14 204) (14 155) (14 367)
Gross profit 4 820 4 788 4 848
Gross margin 25.3% 25.3% 25.2%
Other operating income 32 96 108 83
Selling, general and administrative expenses 31 (3 962) (3 923) (3 965)
Other operating expenses 33 (50) (36) (19)
Operating profit 904 937 947
Operating margin 4.8% 4.9% 4.9%
Finance costs 34 (213) (347) (296)
Income from investments 35 11 15 20
Profit before taxes and discontinued operations 702 605 671
Income tax expense 26 (217) (204) (245)
Net profit from continuing operations 485 401 426
Result from discontinued operations (net of tax) 28 (6) 24 (65)
Net profit 479 425 361
Net profit attributable to minority interest 12 15 9
Net profit attributable to equity holders of the Group
(Group share in net profit) 467 410 352
(1) Adjusted for reclassification of German operations to discontinued operations.
(in EUR)
Earnings per share 27
Basic
Net profit from continuing operations 4.76 3.95 4.40
Group share in net profit 4.70 4.20 3.71
Diluted
Net profit from continuing operations 4.65 3.80 4.19
Group share in net profit 4.59 4.04 3.55
(in thousands)
Weighted average number of shares outstanding
Basic 99 385 97 666 94 939
Diluted 103 131 103 448 101 906
Consolidated Statements of Recognized Income and Expense
(in millions of EUR) 2008 2007 2006
Amortization of deferred gain (loss) on hedge, net of tax 1 11 3
Unrealized gain (loss) on securities held for sale, net of tax 6 1 -
Actuarial gain (loss) on defined benefit plans, net of tax (19) 7 10
Exchange differences gain (loss) on translation of foreign currency operations 185 (387) (357)
Net income (expense) recognized directly in equity 173 (368) (344)
Net profit 479 425 361
Total recognized income and expense for the period 652 57 17
Amount attributable to minority interest 12 15 8
Amount attributable to equity holders of the Group 640 42 9
66 - Delhaize Group - Annual Report 2008
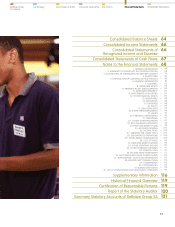
Consolidated
Balance Sheets
Consolidated
Income Statements
Consolidated Statements of
Recognized Income and Expense
Consolidated
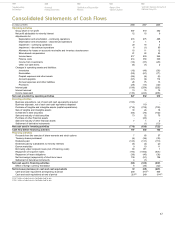
Statements of Cash Flows
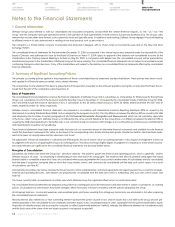
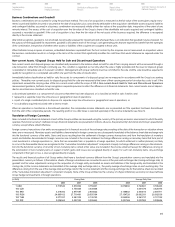
Notes to the
Financial Statements