Food Lion 2008 Annual Report Download - page 56
Download and view the complete annual report
Please find page 56 of the 2008 Food Lion annual report below. You can navigate through the pages in the report by either clicking on the pages listed below, or by using the keyword search tool below to find specific information within the annual report.-
 1
1 -
2
-
3
-
4
-
5
-
6
-
7
-
8
-
9
-
10
-
11
-
12
-
13
-
14
-
15
-
16
-
17
-
18
-
19
-
20
-
21
-
22
-
23
-
24
-
25
-
26
-
27
-
28
-
29
-
30
-
31
-
32
-
33
-
34
-
35
-
36
-
37
-
38
-
39
-
40
-
41
-
42
-
43
-
44
-
45
-
 46
46 -
 47
47 -
 48
48 -
 49
49 -
 50
50 -
 51
51 -
 52
52 -
 53
53 -
 54
54 -
 55
55 -
 56
56 -
 57
57 -
 58
58 -
 59
59 -
 60
60 -
 61
61 -
 62
62 -
 63
63 -
 64
64 -
 65
65 -
 66
66 -
67
-
68
-
69
-
70
-
71
-
72
-
73
-
74
-
75
-
76
-
77
-
78
-
79
-
80
-
81
-
82
-
83
-
84
-
85
-
86
-
87
-
88
-
89
-
90
-
91
-
92
-
93
-
94
-
95
-
96
-
97
-
98
-
99
-
100
-
101
-
102
-
103
-
104
-
105
-
106
-
107
-
108
-
109
-
110
-
111
-
112
-
113
-
114
-
115
-
116
-
117
-
118
-
119
-
120
-
121
-
122
-
123
-
124
-
125
-
126
-
127
-
128
-
129
-
130
-
131
-
132
-
133
-
134
-
135
 |
 |

52 - Delhaize Group - Annual Report 2008
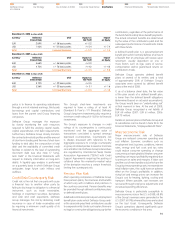
Annual
Bonus
(1)
(in millions of EUR)
CEO
Others Members of
Executive Management
Number of
persons Payout
2008
0.7 71.8
2007
0.7 91.8
2006
0.5 81.3
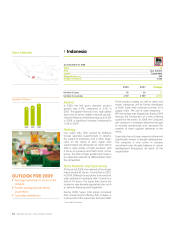
In 2009, the CEO and other members of
the Executive Management will receive
payment of their annual bonus related to their
performance during 2008. In accordance with
the above scale, the CEO will be paid EUR 0.6
million and the other members of the Executive
Management in the aggregate will be paid
EUR 1.3 million (these amounts are gross
before deduction of withholding taxes and
social security levy).
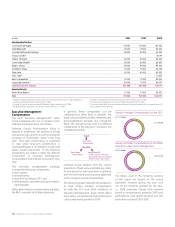
Long-Term Incentives
The long-term incentive plan is designed
to retain the Executive Management team
and reward long-term success of the Group.
Delhaize Group’s long-term incentive plan
consists of three components.
> Stock options and warrants;
> Restricted stock unit awards (mostly
applicable in the U.S.); and
> Performance cash grants.
These components typically constituted
approx imately 25%, 25% and 50% of the total
value of long-term incentives respectively.
Stock Options / Warrants
In 2008, 176 400 stock options were granted
to the Executive Management of Delhaize
Group. The exercise price per share for the
stock options granted in 2008 amounted to
EUR 49.25 for options on ordinary shares
traded on Euronext Brussels and USD 74.76
for options related to the Company’s American
Depositary Shares traded on the New York
Stock Exchange.
The options granted in May 2008 under the
Delhaize Group 2002 Stock Incentive Plan
for executives of the Group’s U.S. operating
companies vest over a three-year period
following the grant date. Options granted in
May 2008 under the 2007 Stock Option Plan for
other executives vest after a three and a half-
year period following the grant date.
For more details on the share-based incentive
plans see Note 29 in the financial statements.
The value of the stock option grant determines
the number of options awarded. The value is
determined each year at the time of the grant
using the Black-Scholes formula. The value
of the stock option may vary from year to
year. As a result, the total number of options
granted can also be different from year to
year.
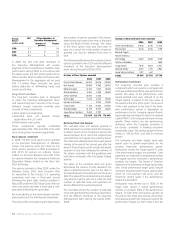
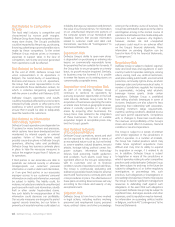
The following table shows the number of stock
options granted to the CEO and the different
members of the Executive Management
team during the period 2006-2008.
Number of Stock Options awarded
2006 2007 2008
Pierre-Olivier Beckers
35 000 26 216 42 000
Rick Anicetti
20 989 17 982 26 900
Renaud Cogels
13 500 11 475 18 000
Michel Eeckhout
4 000 3 400 16 500
Arthur Goethals
10 000 8 500 -
Ron Hodge
15 175 13 012 19 500
Nicolas Hollanders
-10 910 10 500
Craig Owens
17 378 16 283 24 200
Michael Waller
14 575 12 574 18 800
Joyce Wilson-Sanford
2 842 2 227 -
TOTAL
133 459 122 579 176 400
Restricted Stock Unit Awards
The restricted stock unit awards granted in
2008, represent a commitment of the Company
to deliver shares of the Company’s stock to the
award recipient, at no cost to the recipient (one
restricted stock unit equals one ordinary share).
The shares are delivered over a five-year period
starting at the end of the second year after the
award. These shares can be sold by the award
recipient at any time following the delivery of
the shares consistent with the guidelines and
restrictions contained in the Company’s trading
policies.
The value of the restricted stock unit grant
determines the number of units awarded. The
value is determined each year on the date of
the award based on the stock price on the grant
date. The value of the restricted stock unit award
may vary from year to year. As a result, the total
number of restricted stock units granted can
also be different from period to period.
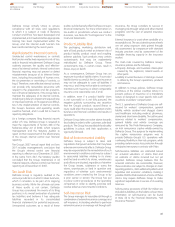
The next table shows the number of restricted
stock units granted to the Chief Executive Officer
and the different members of the Executive
Management team during the period 2006-
2008.
Number of Restricted Stock Units awarded
2006 2007 2008
Pierre-Olivier Beckers
10 043 8 445 12 234
Rick Anicetti
8 744 5 305 7 109
Renaud Cogels
- - -
Michel Eeckhout
- - -
Ron Hodge
6 322 3 839 5 139
Nicolas Hollanders
- - 1 660
Craig Owens
7 240 4 804 6 437
Michael Waller
6 072 3 710 4 967
Joyce Wilson-Sanford
1 027 657 -
TOTAL
39 448 26 760 37 546
Performance Cash Grant
The long-term incentive plan includes a
component which can result in a cash payment
in the period following a three-year performance
period. The value of the performance cash
award granted each year, referred to as the
“target award”, is based on the face value of
the award at the time of the grant. The amount
of the cash payment at the end of the three-
year performance period is dependent on
performance by the Company against Board-
approved financial targets for return on invested
capital (“ROIC”) and compound annual revenue
growth. These metrics are key performance
indicators which the Company considers to
be closely correlated to building long-term
shareholder value. The relative weight for these
metrics is 70% for ROIC and 30% for revenue
growth.
The Company sets these targets each year
based upon its growth expectations for the
ensuing three-year performance period.
Participants receive the “target award” in cash
if the performance targets are achieved. Cash
payments are reduced for performance below
the targets and are increased if performance
exceeds the targets. The Board of Directors
determines the performance target goals every
year. These performance target goals include
minimum threshold performance goals below
which no cash payment will occur, and the
maximum award levels if the performance
targets are exceeded.
Participants may receive up to 150% of the
target cash award if actual performance
reaches or exceeds 120% of the performance
targets for both ROIC and revenue growth. At
the end of each three-year period, actual ROIC
and revenue growth are measured against the
performance targets for both metrics and the