Food Lion 2008 Annual Report Download - page 32
Download and view the complete annual report
Please find page 32 of the 2008 Food Lion annual report below. You can navigate through the pages in the report by either clicking on the pages listed below, or by using the keyword search tool below to find specific information within the annual report.-
 1
1 -
2
-
3
-
4
-
5
-
6
-
7
-
8
-
9
-
10
-
11
-
12
-
13
-
14
-
15
-
16
-
17
-
18
-
19
-
20
-
21
-
 22
22 -
 23
23 -
 24
24 -
 25
25 -
 26
26 -
 27
27 -
 28
28 -
 29
29 -
 30
30 -
 31
31 -
 32
32 -
 33
33 -
 34
34 -
 35
35 -
 36
36 -
 37
37 -
 38
38 -
 39
39 -
 40
40 -
 41
41 -
 42
42 -
43
-
44
-
45
-
46
-
47
-
48
-
49
-
50
-
51
-
52
-
53
-
54
-
55
-
56
-
57
-
58
-
59
-
60
-
61
-
62
-
63
-
64
-
65
-
66
-
67
-
68
-
69
-
70
-
71
-
72
-
73
-
74
-
75
-
76
-
77
-
78
-
79
-
80
-
81
-
82
-
83
-
84
-
85
-
86
-
87
-
88
-
89
-
90
-
91
-
92
-
93
-
94
-
95
-
96
-
97
-
98
-
99
-
100
-
101
-
102
-
103
-
104
-
105
-
106
-
107
-
108
-
109
-
110
-
111
-
112
-
113
-
114
-
115
-
116
-
117
-
118
-
119
-
120
-
121
-
122
-
123
-
124
-
125
-
126
-
127
-
128
-
129
-
130
-
131
-
132
-
133
-
134
-
135
 |
 |

2006 2007 2008
947
937
904
28 - Delhaize Group - Annual Report 2008
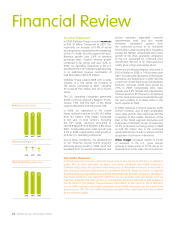
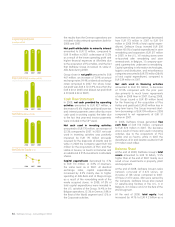
Revenues (in billions of EUR)
Operating Margin (in %)
Operating Profit (in millions of EUR)
Financial Review
Income Statement
In 2008, Delhaize Group recorded revenues
of EUR 19 billion. Compared to 2007, this
represents an increase of 0.4% at actual
exchange rates, impacted by the weakening
of the U.S. dollar by 6.8% against the euro.
Revenue growth was 5.6% at identical
exchange rates. Organic revenue growth
continued to be strong and was 4.2%. In
2008, our operating companies in the U.S.
benefited from a 53
rd
calendar week resulting
in an additional revenue contribution of
EUR 258 million (USD 379 million).
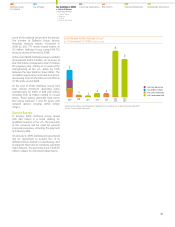
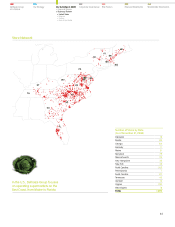
Delhaize Group ended 2008 with a sales
network of 2 673 stores, an increase of
128 stores compared to 2007, including
29 acquired Plus Hellas and 14 La Fourmi
stores.
The U.S. operating companies generated
68.8% of Group revenues, Belgium 23.2%,
Greece 7.0% and the Rest of the World
segment (Romania and Indonesia) 1.0%.
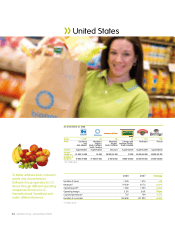
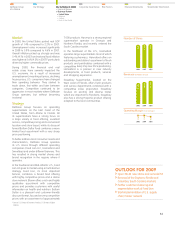
In 2008, our operations in the United
States realized revenues of USD 19.2 billion
(EUR 13.1 billion), 5.9% higher compared
to last year, in local currency. Excluding
the 53
rd
week, revenues amounted to
USD 18.9 billion (EUR 12.8 billion), 3.8% above
2007. Comparable store sales growth was
2.5% in 2008 supported by solid growth in
all three U.S. operating companies.
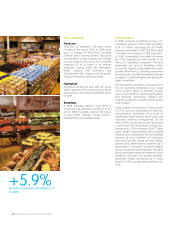
Across these companies, the development
of our three-tier private brand program
delivered strong results in 2008. Food Lion
benefited from increased promotional and
pricing initiatives, expanded customer
segmentation work and four market
renewals. Hannaford gained from
the continued success of its nutritional
information system Guiding Stars. Sweetbay
posted the highest comparable store sales
growth of the three operating companies
in the U.S. supported by continued price
investments that led to an improved price
reality, price image and market share.
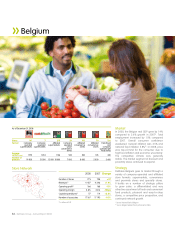
Revenues at Delhaize Belgium amounted to
EUR 4.4 billion in 2008, a 1.4% increase over
2007. Excluding the divestiture of the beauty
and body care business Di in 2007 and the
conversion of Cash Fresh stores into Delhaize
banners, revenues would have grown by
2.9% in 2008. Comparable store sales
growth was 2.2%. Market share declined by
54 basis points to 25.1% (source: AC Nielsen)
but the trend improved consistently through
the year resulting in a stable share in the
fourth quarter of 2008.
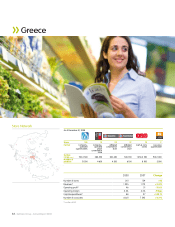
In 2008, revenues in Greece grew by 13.8%
to EUR 1.3 billion, due to high comparable
store sales growth, store openings and the
acquisition of Plus Hellas. Revenues of the
Rest of the World segment (Romania and
Indonesia) of Delhaize Group increased by
35.8% (at identical exchange rates) in 2008
to EUR 201 million due to the continued
good performance in both countries and the
acquisition of La Fourmi in Romania.
Gross margin increased slightly to 25.3%
of revenues. In the U.S., gross margin
grew by 31 basis points to 27.7% due to an
improvement in the sales mix at Food Lion
Non-GAAP Measures
In its financial communication, Delhaize Group uses certain measures that have no definition
under IFRS or other generally accepted accounting standards (non-GAAP measures).
Delhaize Group does not represent these measures as alternative measures to net profit or
other financial measures determined in accordance with IFRS. These measures as reported
by Delhaize Group might differ from similarly titled measures by other companies. We believe
that these measures are important indicators for our business and are widely used by
investors, analysts and other parties. A reconciliation of these measures to IFRS measures
can be found in the chapter “Supplementary Information” of this report p. 116. A definition
of non-GAAP measures and ratios composed of non-GAAP measures can be found in the
glossary on p. 128. The non-GAAP measures provided in this report have not been audited
by the statutory auditor.
2006 2007 2008
4.9
4.9
4.8
2006 2007 2008
19.2
18.9
19.0