Food Lion 2008 Annual Report Download - page 120
Download and view the complete annual report
Please find page 120 of the 2008 Food Lion annual report below. You can navigate through the pages in the report by either clicking on the pages listed below, or by using the keyword search tool below to find specific information within the annual report.-
 1
1 -
2
-
3
-
4
-
5
-
6
-
7
-
8
-
9
-
10
-
11
-
12
-
13
-
14
-
15
-
16
-
17
-
18
-
19
-
20
-
21
-
22
-
23
-
24
-
25
-
26
-
27
-
28
-
29
-
30
-
31
-
32
-
33
-
34
-
35
-
36
-
37
-
38
-
39
-
40
-
41
-
42
-
43
-
44
-
45
-
46
-
47
-
48
-
49
-
50
-
51
-
52
-
53
-
54
-
55
-
56
-
57
-
58
-
59
-
60
-
61
-
62
-
63
-
64
-
65
-
66
-
67
-
68
-
69
-
70
-
71
-
72
-
73
-
74
-
75
-
76
-
77
-
78
-
79
-
80
-
81
-
82
-
83
-
84
-
85
-
86
-
87
-
88
-
89
-
90
-
91
-
92
-
93
-
94
-
95
-
96
-
97
-
98
-
99
-
100
-
101
-
102
-
103
-
104
-
105
-
106
-
107
-
108
-
109
-
 110
110 -
 111
111 -
 112
112 -
 113
113 -
 114
114 -
 115
115 -
 116
116 -
 117
117 -
 118
118 -
 119
119 -
 120
120 -
 121
121 -
 122
122 -
 123
123 -
 124
124 -
 125
125 -
 126
126 -
 127
127 -
 128
128 -
 129
129 -
 130
130 -
131
-
132
-
133
-
134
-
135
 |
 |

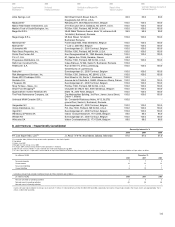
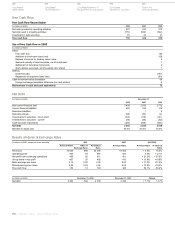
Supplementary Information
Quarterly Data (Unaudited)
(in millions of EUR, except earnings per share)
2008 Full Year 1st Quarter 2nd Quarter 3rd Quarter 4th Quarter
Revenues 19 024 4 494 4 450 4 662 5 418
Gross profit 4 820 1 136 1 109 1 172 1 403
Gross margin 25.3% 25.3% 24.9% 25.1% 25.9%
Selling, general and administrative expenses (3 962) (949) (932) (978) (1 103)
as a percentage of revenues 20.8% 21.1% 21.0% 21.0% 20.4%
Operating profit 904 206 194 215 289
Operating margin 4.8% 4.6% 4.4% 4.6% 5.3%
Net profit from continuing operations 485 105 113 103 164
Group share in net profit 467 102 116 100 149
Group share in net profit per share:
Basic 4.70 1.02 1.17 1.01 1.50
Diluted 4.59 1.00 1.14 0.98 1.46
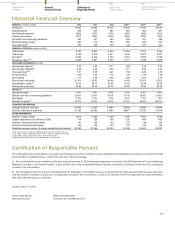
2007 Full Year 1st Quarter 2nd Quarter 3rd Quarter 4th Quarter
Revenues 18 943 4 709 4 810 4 747 4 677
Gross profit 4 788 1 199 1 226 1 187 1 176
Gross margin 25.3% 25.5% 25.5% 25.0% 25.2%
Selling, general and administrative expenses (3 923) (986) (998) (995) (944)
as a percentage of revenues 20.7% 20.9% 20.7% 21.0% 20.2%
Operating profit 937 230 249 215 243
Operating margin 4.9% 4.9% 5.2% 4.5% 5.2%
Net profit from continuing operations 401 110 63 107 121
Group share in net profit 410 111 82 103 114
Group share in net profit per share:
Basic 4.20 1.16 0.84 1.04 1.15
Diluted 4.04 1.11 0.81 1.01 1.12
2006 Full Year 1st Quarter 2nd Quarter 3rd Quarter 4th Quarter
Revenues 19 215 4 733 4 828 4 810 4 844
Gross profit 4 848 1 212 1 217 1 204 1 215
Gross margin 25.2% 25.6% 25.2% 25.0% 25.1%
Selling, general and administrative expenses (3 965) (999) (1 000) (993) (973)
as a percentage of revenues 20.6% 21.1% 20.7% 20.6% 20.1%
Operating profit 947 227 228 230 262
Operating margin 4.9% 4.8% 4.7% 4.8% 5.4%
Net profit from continuing operations 426 98 97 109 122
Group share in net profit 352 97 95 45 115
Group share in net profit per share:
Basic 3.71 1.03 1.00 0.48 1.20
Diluted 3.55 0.99 0.96 0.47 1.14
116 - Delhaize Group - Annual Report 2008
Consolidated
Balance Sheets
Consolidated
Income Statements
Consolidated Statements of
Recognized Income and Expense
Consolidated
Statements of Cash Flows
Notes to the
Financial Statements