Food Lion 2008 Annual Report Download - page 105
Download and view the complete annual report
Please find page 105 of the 2008 Food Lion annual report below. You can navigate through the pages in the report by either clicking on the pages listed below, or by using the keyword search tool below to find specific information within the annual report.-
 1
1 -
2
-
3
-
4
-
5
-
6
-
7
-
8
-
9
-
10
-
11
-
12
-
13
-
14
-
15
-
16
-
17
-
18
-
19
-
20
-
21
-
22
-
23
-
24
-
25
-
26
-
27
-
28
-
29
-
30
-
31
-
32
-
33
-
34
-
35
-
36
-
37
-
38
-
39
-
40
-
41
-
42
-
43
-
44
-
45
-
46
-
47
-
48
-
49
-
50
-
51
-
52
-
53
-
54
-
55
-
56
-
57
-
58
-
59
-
60
-
61
-
62
-
63
-
64
-
65
-
66
-
67
-
68
-
69
-
70
-
71
-
72
-
73
-
74
-
75
-
76
-
77
-
78
-
79
-
80
-
81
-
82
-
83
-
84
-
85
-
86
-
87
-
88
-
89
-
90
-
91
-
92
-
93
-
94
-
 95
95 -
 96
96 -
 97
97 -
 98
98 -
 99
99 -
 100
100 -
 101
101 -
 102
102 -
 103
103 -
 104
104 -
 105
105 -
 106
106 -
 107
107 -
 108
108 -
 109
109 -
 110
110 -
 111
111 -
 112
112 -
 113
113 -
 114
114 -
 115
115 -
116
-
117
-
118
-
119
-
120
-
121
-
122
-
123
-
124
-
125
-
126
-
127
-
128
-
129
-
130
-
131
-
132
-
133
-
134
-
135
 |
 |

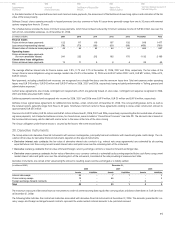
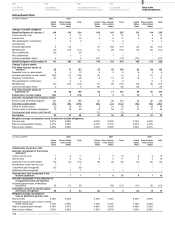
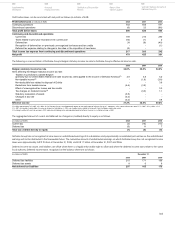
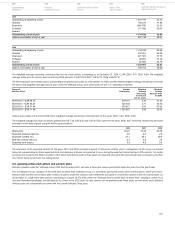
(in millions of EUR) 2008 2007 2006
United Plans Outside Total United Plans Outside Total United Plans Outside Total
States of the United States of the United States of the United
Plans States Plans States Plans States
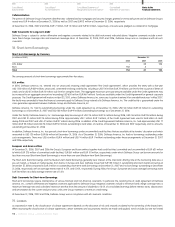
Historic Information
Defined benefit obligation 111 106 217 104 110 214 109 116 225
Plan Assets 79 69 148 82 71 153 85 65 150
Surplus or (Benefit) 32 37 69 21 39 60 24 51 75
Experience gains and losses:
Related to plan assets 28 1 29 1 - 1 (4) 1 (3)
Percentage of plan assets 35.61% 0.87% 19.38% 0.30% -0.14% 0.13% -5.10% 0.44% -2.73%
Related to plan liabilities 2 1 3 1 - 1 (3) 1 (2)
Percentage of plan liabilities 1.83% 1.13% 1.51% 0.63% 0.09% 0.37% -2.48% 0.84% -0.76%
in millions of EUR) 2005 2004
United Plans Outside Total United Plans Outside Total
States of the United States of the United
Plans States Plans States
Historic Information
Defined benefit obligation 121 114 235 95 100 195
Plan Assets 82 60 142 65 61 126
Surplus or (Benefit) 39 54 93 30 39 69
Experience gains and losses:
Related to plan assets 1 1 2 (2) - (2)
Percentage of plan assets 0.68% 1.01% 0.85% -2.29% 0.50% -0.95%
Related to plan liabilities 1 12 13 (1) - (1)
Percentage of plan liabilities 0.45% 10.22% 5.18% -1.07% - -0.52%
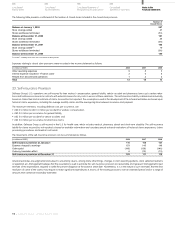
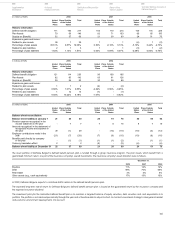
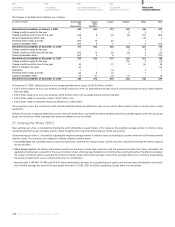
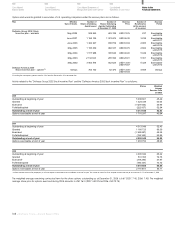
(in millions of EUR) 2008 2007 2006
United Plans Outside Total United Plans Outside Total United Plans Outside Total
States of the United States of the United States of the United
Plans States Plans States Plans States
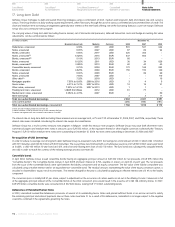
Balance sheet reconciliation:
Balance sheet liability at January 1 21 39 60 24 51 75 40 54 94
Pension expense recognized in the
income statement in the year - 7 7 7 8 15 8 7 15
Amounts recognized in the statement of
recognized income and expense in
the year 30 (1) 29 - (10) (10) (10) (3) (13)
Employer contributions made in the
year (21) (7) (28) (7) (9) (16) (10) (6) (16)
Benefits paid directly by company
in the year - (1) (1) (1) (1) (2) - (1) (1)
Currency translation effect 2 - 2 (2) - (2) (4) - (4)
Balance sheet liability at December 31 32 37 69 21 39 60 24 51 75
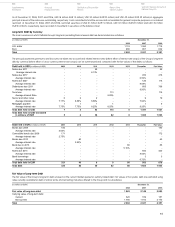
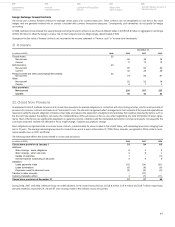
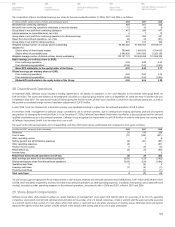
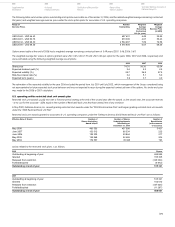
The asset portfolio of Delhaize Belgium’s defined benefit pension plan is funded through a group insurance program. The plan assets, which benefit from a
guaranteed minimum return, are part of the insurance company’s overall investments. The insurance company’s asset allocation was as follows:
December 31,
2008 2007 2006
Equities 11% 12% 12%
Debt 69% 70% 69%
Real estate 3% 3% 4%
Other assets (e.g., cash equivalents) 17% 15% 15%
In 2009, Delhaize Belgium expects to contribute EUR 8 million to the defined benefit pension plan.
The expected long-term rate of return for Delhaize Belgium’s defined benefit pension plan is based on the guaranteed return by the insurance company and
the expected insurance dividend.
The investment policy for the Hannaford defined benefit plan is to maintain a targeted balance of equity securities, debt securities and cash equivalents in its
portfolio. The portfolio is re-balanced periodically through the year and is therefore able to adjust its short- to mid-term investment strategy to take general market
and economic environment developments into account.
101
Certification of Responsible
Persons
Historical
Financial Overview
Report of the
Statutory Auditor
Summary Statutory Accounts of
Delhaize Group SA
Supplementary
Information