Cigna 2015 Annual Report Download - page 89
Download and view the complete annual report
Please find page 89 of the 2015 Cigna annual report below. You can navigate through the pages in the report by either clicking on the pages listed below, or by using the keyword search tool below to find specific information within the annual report.-
 1
1 -
2
-
3
-
4
-
5
-
6
-
7
-
8
-
9
-
10
-
11
-
12
-
13
-
14
-
15
-
16
-
17
-
18
-
19
-
20
-
21
-
22
-
23
-
24
-
25
-
26
-
27
-
28
-
29
-
30
-
31
-
32
-
33
-
34
-
35
-
36
-
37
-
38
-
39
-
40
-
41
-
42
-
43
-
44
-
45
-
46
-
47
-
48
-
49
-
50
-
51
-
52
-
53
-
54
-
55
-
56
-
57
-
58
-
59
-
60
-
61
-
62
-
63
-
64
-
65
-
66
-
67
-
68
-
69
-
70
-
71
-
72
-
73
-
74
-
75
-
76
-
77
-
78
-
 79
79 -
 80
80 -
 81
81 -
 82
82 -
 83
83 -
 84
84 -
 85
85 -
 86
86 -
 87
87 -
 88
88 -
 89
89 -
 90
90 -
 91
91 -
 92
92 -
 93
93 -
 94
94 -
 95
95 -
 96
96 -
 97
97 -
 98
98 -
 99
99 -
100
-
101
-
102
-
103
-
104
-
105
-
106
-
107
-
108
-
109
-
110
-
111
-
112
-
113
-
114
-
115
-
116
-
117
-
118
-
119
-
120
-
121
-
122
-
123
-
124
-
125
-
126
-
127
-
128
-
129
-
130
-
131
-
132
-
133
-
134
-
135
-
136
-
137
-
138
-
139
-
140
-
141
-
142
-
143
-
144
-
145
-
146
-
147
-
148
-
149
-
150
-
151
-
152
-
153
-
154
-
155
-
156
-
157
-
158
-
159
-
160
-
161
-
162
-
163
-
164
-
165
-
166
-
167
-
168
-
169
-
170
-
171
-
172
-
173
-
174
-
175
-
176
-
177
-
178
-
179
-
180
 |
 |

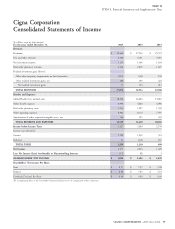
PART II
ITEM 8. Financial Statements and Supplementary Data
Cigna Corporation
Consolidated Statements of Income
(In millions, except per share amounts)
For the years ended December 31, 2015 2014 2013
Revenues
Premiums $ 29,642 $ 27,214 $ 25,575
Fees and other revenues 4,488 4,141 3,601
Net investment income 1,153 1,166 1,164
Mail order pharmacy revenues 2,536 2,239 1,827
Realized investment gains (losses):
Other-than-temporary impairments on fixed maturities (112) (36) (11)
Other realized investment gains, net 169 190 224
Net realized investment gains 57 154 213
TOTAL REVENUES 37,876 34,914 32,380
Benefits and Expenses
Global Health Care medical costs 18,354 16,694 15,867
Other benefit expenses 4,936 4,640 4,998
Mail order pharmacy costs 2,134 1,907 1,509
Other operating expenses 8,982 8,174 7,595
Amortization of other acquired intangible assets, net 143 195 235
TOTAL BENEFITS AND EXPENSES 34,549 31,610 30,204
Income before Income Taxes 3,327 3,304 2,176
Income taxes (benefits):
Current 1,229 1,232 501
Deferred 21 (22) 197
TOTAL TAXES 1,250 1,210 698
Net Income 2,077 2,094 1,478
Less: Net Income (Loss) Attributable to Noncontrolling Interests (17) (8) 2
SHAREHOLDERS’ NET INCOME $ 2,094 $ 2,102 $ 1,476
Shareholders’ Net Income Per Share:
Basic $ 8.17 $ 7.97 $ 5.28
Diluted $ 8.04 $ 7.83 $ 5.18
Dividends Declared Per Share $ 0.04 $ 0.04 $ 0.04
The accompanying Notes to the Consolidated Financial Statements are an integral part of these statements.
CIGNA CORPORATION - 2015 Form 10-K 59