Cigna 2015 Annual Report Download - page 116
Download and view the complete annual report
Please find page 116 of the 2015 Cigna annual report below. You can navigate through the pages in the report by either clicking on the pages listed below, or by using the keyword search tool below to find specific information within the annual report.-
 1
1 -
2
-
3
-
4
-
5
-
6
-
7
-
8
-
9
-
10
-
11
-
12
-
13
-
14
-
15
-
16
-
17
-
18
-
19
-
20
-
21
-
22
-
23
-
24
-
25
-
26
-
27
-
28
-
29
-
30
-
31
-
32
-
33
-
34
-
35
-
36
-
37
-
38
-
39
-
40
-
41
-
42
-
43
-
44
-
45
-
46
-
47
-
48
-
49
-
50
-
51
-
52
-
53
-
54
-
55
-
56
-
57
-
58
-
59
-
60
-
61
-
62
-
63
-
64
-
65
-
66
-
67
-
68
-
69
-
70
-
71
-
72
-
73
-
74
-
75
-
76
-
77
-
78
-
79
-
80
-
81
-
82
-
83
-
84
-
85
-
86
-
87
-
88
-
89
-
90
-
91
-
92
-
93
-
94
-
95
-
96
-
97
-
98
-
99
-
100
-
101
-
102
-
103
-
104
-
105
-
 106
106 -
 107
107 -
 108
108 -
 109
109 -
 110
110 -
 111
111 -
 112
112 -
 113
113 -
 114
114 -
 115
115 -
 116
116 -
 117
117 -
 118
118 -
 119
119 -
 120
120 -
 121
121 -
 122
122 -
 123
123 -
 124
124 -
 125
125 -
 126
126 -
127
-
128
-
129
-
130
-
131
-
132
-
133
-
134
-
135
-
136
-
137
-
138
-
139
-
140
-
141
-
142
-
143
-
144
-
145
-
146
-
147
-
148
-
149
-
150
-
151
-
152
-
153
-
154
-
155
-
156
-
157
-
158
-
159
-
160
-
161
-
162
-
163
-
164
-
165
-
166
-
167
-
168
-
169
-
170
-
171
-
172
-
173
-
174
-
175
-
176
-
177
-
178
-
179
-
180
 |
 |

PART II
ITEM 8. Financial Statements and Supplementary Data
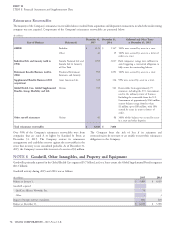
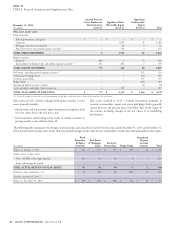
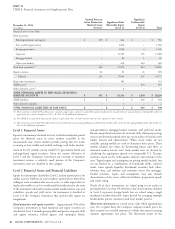
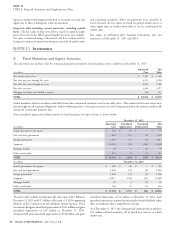
Unobservable Unobservable Adjustment
As of December 31, 2014
(Fair value in millions)
Fair Value Input Range (Weighted Average)
Fixed maturities:
Other asset and mortgage-backed securities $ 417 Liquidity 60 - 370 (140) bps
Weighting of credit spreads 160 - 2,560 (290) bps
Corporate and government fixed maturities 344 Liquidity 80 - 930 (262) bps
Total fixed maturities 761
Equity securities 43 Price-to-earnings multiples 4.2 - 9.8 (8.1)
Subtotal 804
Securities not priced by the Company
(1)
53
Total Level 3 securities $ 857
(1) The fair values for these securities use single, unadjusted non-binding broker quotes not developed directly by the Company.
Significant increases in fixed maturity spreads would result in a lower through a model utilizing various assumptions that include
fair value measurement while decreases in these inputs would result in non-performance risk, among other things.
a higher fair value measurement. Significant decreases in equity The non-performance risk adjustment is incorporated by adding an
price-to-earnings multiples would result in a lower fair value additional spread to the discount rate in the calculation of both (a) the
measurement while increases in these inputs would result in a higher GMIB liabilities to reflect a market participant’s view of the risk of the
fair value measurement. Generally, the unobservable inputs are not Company not fulfilling its GMIB obligations, and (b) the GMIB
interrelated and a change in the assumption used for one unobservable assets to reflect a market participant’s view of the credit risk of the
input is not accompanied by a change in the other unobservable reinsurers, after considering collateral.
input. Other assumptions that affect GMIB assets and liabilities include
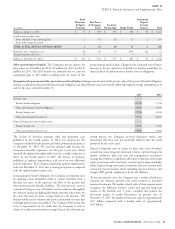
GMIB contracts. As discussed in Note 7, the Company effectively capital market assumptions (including market returns, interest rates
exited the GMIB business in 2013. Although these GMIB assets and and market volatilities of the underlying equity and bond mutual fund
liabilities must continue to be reported as derivatives at fair value, the investments) and future annuitant behavior (including mortality,
only assumption that is expected to impact future shareholders’ net lapse, and annuity election rates). As certain assumptions used to
income is the risk of non-performance. This assumption reflects a estimate fair values for these contracts are largely unobservable
market participant’s view of (a) the risk of the Company not fulfilling (primarily related to future annuitant behavior), the Company
its GMIB obligations (GMIB liabilities) and (b) the credit risk that classifies GMIB assets and liabilities in Level 3.
the reinsurers do not pay their obligations (GMIB assets). As of The Company regularly evaluates each of the assumptions used in
December 31, 2015, there were three reinsurers for GMIB, with establishing these assets and liabilities. Significant decreases in
collateral securing 70% of the balance. assumed lapse rates or spreads used to calculate non-performance risk,
The Company reports GMIB liabilities and assets as derivatives at fair or increases in assumed annuity election rates, would result in higher
value because cash flows of these liabilities and assets are affected by fair value measurements. A change in one of these assumptions is not
equity markets and interest rates, but are without significant life necessarily accompanied by a change in another assumption.
insurance risk and are settled in lump sum payments. Under the terms GMIB liabilities are reported in the Company’s Consolidated Balance
of these written and purchased contracts, the Company periodically Sheets in accounts payable, accrued expenses and other liabilities.
receives and pays fees based on either contractholders’ account values GMIB assets associated with these contracts represent net receivables
or deposits increased at a contractual rate. The Company will also pay in connection with reinsurance that the Company has purchased from
and receive cash depending on account values and interest rates when three external reinsurers and are reported in the Company’s
contractholders elect to begin to receive minimum income payments. Consolidated Balance Sheets in other assets, including other
The Company estimates the fair value of the assets and liabilities for intangibles.
GMIB contracts by calculating the results for many scenarios run
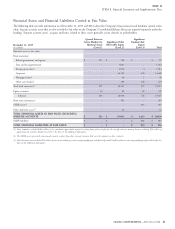
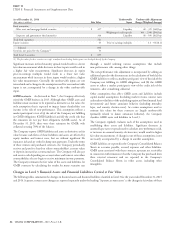
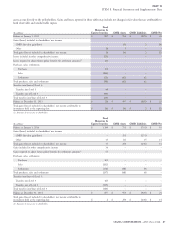
Changes in Level 3 Financial Assets and Financial Liabilities Carried at Fair Value
The following tables summarize the changes in financial assets and financial liabilities classified in Level 3 for the years ended December 31, 2015
and 2014. Separate account asset changes are reported separately under the heading ‘‘Separate account assets’’ as the changes in fair values of these
86 CIGNA CORPORATION - 2015 Form 10-K