Cigna 2015 Annual Report Download - page 139
Download and view the complete annual report
Please find page 139 of the 2015 Cigna annual report below. You can navigate through the pages in the report by either clicking on the pages listed below, or by using the keyword search tool below to find specific information within the annual report.-
 1
1 -
2
-
3
-
4
-
5
-
6
-
7
-
8
-
9
-
10
-
11
-
12
-
13
-
14
-
15
-
16
-
17
-
18
-
19
-
20
-
21
-
22
-
23
-
24
-
25
-
26
-
27
-
28
-
29
-
30
-
31
-
32
-
33
-
34
-
35
-
36
-
37
-
38
-
39
-
40
-
41
-
42
-
43
-
44
-
45
-
46
-
47
-
48
-
49
-
50
-
51
-
52
-
53
-
54
-
55
-
56
-
57
-
58
-
59
-
60
-
61
-
62
-
63
-
64
-
65
-
66
-
67
-
68
-
69
-
70
-
71
-
72
-
73
-
74
-
75
-
76
-
77
-
78
-
79
-
80
-
81
-
82
-
83
-
84
-
85
-
86
-
87
-
88
-
89
-
90
-
91
-
92
-
93
-
94
-
95
-
96
-
97
-
98
-
99
-
100
-
101
-
102
-
103
-
104
-
105
-
106
-
107
-
108
-
109
-
110
-
111
-
112
-
113
-
114
-
115
-
116
-
117
-
118
-
119
-
120
-
121
-
122
-
123
-
124
-
125
-
126
-
127
-
128
-
 129
129 -
 130
130 -
 131
131 -
 132
132 -
 133
133 -
 134
134 -
 135
135 -
 136
136 -
 137
137 -
 138
138 -
 139
139 -
 140
140 -
 141
141 -
 142
142 -
 143
143 -
 144
144 -
 145
145 -
 146
146 -
 147
147 -
 148
148 -
 149
149 -
150
-
151
-
152
-
153
-
154
-
155
-
156
-
157
-
158
-
159
-
160
-
161
-
162
-
163
-
164
-
165
-
166
-
167
-
168
-
169
-
170
-
171
-
172
-
173
-
174
-
175
-
176
-
177
-
178
-
179
-
180
 |
 |

PART II
ITEM 8. Financial Statements and Supplementary Data
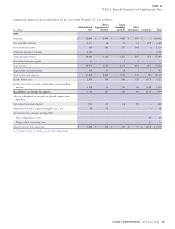
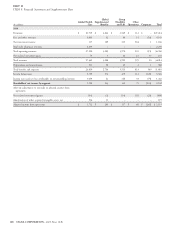
Global Group
Global Health Supplemental Disability Other
(In millions)
Care Benefits and Life Operations Corporate Total
2013
Premiums $ 19,626 $ 2,496 $ 3,348 $ 105 $ – $25,575
Fees and other revenues 3,518 43 78 (24) (14) 3,601
Net investment income 325 100 321 408 10 1,164
Mail order pharmacy revenues 1,827 – – – – 1,827
Total operating revenues 25,296 2,639 3,747 489 (4) 32,167
Net realized investment gains 113 3 62 35 – 213
Total revenues 25,409 2,642 3,809 524 (4) 32,380
Depreciation and amortization 529 50 14 1 3 597
Total benefits and expenses 22,957 2,412 3,387 1,120 328 30,204
Income before taxes 2,452 230 422 (596) (332) 2,176
Income taxes and net loss attributable to noncontrolling interests 862 50 123 (225) (110) 700
Shareholders’ net income by segment 1,590 180 299 (371) (222) 1,476
After-tax adjustments to reconcile to adjusted income from
operations:
Net realized investment (gains) (73) (5) (40) (23) – (141)
Amortization of other acquired intangible assets, net 127 17 – – – 144
Results of GMIB business – – – (25) – (25)
Special items (see summary on Page 106):
Costs associated with PBM service agreement 24 – – – – 24
Charge related to reinsurance transaction – – – 507 – 507
Charge for disability claims regulatory matter – – 51 – – 51
Charge for organizational efficiency plan 31 8 1 – – 40
Adjusted income from operations $ 1,699 $ 200 $ 311 $ 88 $ (222) $ 2,076
CIGNA CORPORATION - 2015 Form 10-K 109