Cash America 2011 Annual Report Download - page 7
Download and view the complete annual report
Please find page 7 of the 2011 Cash America annual report below. You can navigate through the pages in the report by either clicking on the pages listed below, or by using the keyword search tool below to find specific information within the annual report.-
 1
1 -
 2
2 -
 3
3 -
 4
4 -
 5
5 -
 6
6 -
 7
7 -
 8
8 -
 9
9 -
 10
10 -
 11
11 -
 12
12 -
 13
13 -
 14
14 -
 15
15 -
 16
16 -
 17
17 -
 18
18 -
 19
19 -
 20
20 -
 21
21 -
 22
22 -
 23
23 -
 24
24 -
 25
25 -
 26
26 -
 27
27 -
 28
28 -
 29
29 -
 30
30 -
 31
31 -
 32
32 -
 33
33 -
 34
34 -
 35
35 -
 36
36 -
 37
37 -
 38
38 -
 39
39 -
 40
40 -
 41
41 -
 42
42 -
 43
43 -
 44
44 -
 45
45 -
 46
46 -
 47
47 -
 48
48 -
 49
49 -
 50
50 -
 51
51 -
 52
52 -
 53
53 -
 54
54 -
 55
55 -
 56
56 -
 57
57 -
 58
58 -
 59
59 -
 60
60 -
 61
61 -
 62
62 -
 63
63 -
 64
64 -
 65
65 -
 66
66 -
 67
67 -
 68
68 -
 69
69 -
 70
70 -
 71
71 -
 72
72 -
 73
73 -
 74
74 -
 75
75 -
 76
76 -
 77
77 -
 78
78 -
 79
79 -
 80
80 -
 81
81 -
 82
82 -
 83
83 -
 84
84 -
 85
85 -
 86
86 -
 87
87 -
 88
88 -
 89
89 -
 90
90 -
 91
91 -
 92
92 -
 93
93 -
 94
94 -
 95
95 -
 96
96 -
 97
97 -
 98
98 -
 99
99 -
 100
100 -
 101
101 -
 102
102 -
 103
103 -
 104
104 -
 105
105 -
 106
106 -
 107
107 -
 108
108 -
 109
109 -
 110
110 -
 111
111 -
 112
112 -
 113
113 -
 114
114 -
 115
115 -
 116
116 -
 117
117 -
 118
118 -
 119
119 -
 120
120 -
 121
121 -
 122
122 -
 123
123 -
 124
124 -
 125
125 -
 126
126 -
 127
127 -
 128
128 -
 129
129 -
 130
130 -
 131
131 -
 132
132 -
 133
133 -
 134
134 -
 135
135 -
 136
136 -
 137
137 -
 138
138 -
 139
139 -
 140
140 -
 141
141 -
 142
142 -
 143
143 -
 144
144 -
 145
145 -
 146
146 -
 147
147 -
 148
148 -
 149
149 -
 150
150 -
 151
151 -
 152
152 -
 153
153 -
 154
154 -
 155
155 -
 156
156 -
 157
157 -
 158
158 -
 159
159 -
 160
160 -
 161
161 -
 162
162 -
 163
163 -
 164
164 -
 165
165 -
 166
166 -
 167
167 -
 168
168 -
 169
169 -
 170
170 -
 171
171 -
 172
172 -
 173
173 -
 174
174 -
 175
175 -
 176
176 -
 177
177 -
 178
178 -
 179
179 -
 180
180 -
 181
181 -
 182
182 -
 183
183 -
 184
184 -
 185
185 -
 186
186 -
 187
187 -
 188
188 -
 189
189
 |
 |

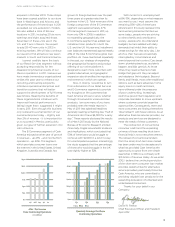
Financial Highlights
CASH AMERICA INTERNATIONAL, INC.
1
Total Revenue
(in millions)
$1,600
$1,400
$1,200
$1,000
$800
$600
$400
$200
$0
10 1107 08 09
Income from Operations
(in millions)
$250
$200
$150
$100
$50
$0
10 1107 08 09
Earnings Per Share
$4.50
$4.00
$3.50
$3.00
$2.50
$2.00
$1.50
$1.00
$0.50
$0.00
10 1107 08 09
Total Loans Written
to Consumers*
(in billions)
*Includes loans funded by third parties
$4.0
$3.5
$3.0
$2.5
$2.0
$1.5
$1.0
$0.5
$0.0
10 1107 08 09
(Dollars in thousands, except share data) 2011 2010 2009
OPERATIONS – years ended December 31
Total revenue $1,540,602 $1,293,339 $1,120,390
Income from operations before
depreciation and amortization 298,491 251,055 217,241
Income from operations 244,342 207,132 175,652
Net income attributable to
Cash America International, Inc. $ 135,963 $ 115,538 $ 96,678
Net income per share – Diluted $ 4.25 $ 3.67 $ 3.17
Dividends per share $ 0.14 $ 0.14 $ 0.14
BALANCE SHEETS – at December 31
Earning assets $ 627,571 $ 482,184 $ 410,925
Total assets 1,674,249 1,427,186 1,269,655
Total debt 537,291 456,704 429,183
Total equity 907,590 802,731 683,199
Current ratio 4.8x 4.8x 4.1x
Debt to equity ratio 59.2% 56.9% 62.8%
Return on assets (a) 8.9% 8.8% 8.2%
Return on equity (a) 15.9% 15.6% 15.4%
Net book value per common share outstanding $ 31.02 $ 27.14 $ 23.29
Common shares outstanding (b) 29,256,333 29,582,290 29,334,702
(a) Returns based on Net Income for the 12-month period divided by the monthly average of total assets and the monthly average of total equity of the Company.
(b) Includes 32,506 shares, 32,421 shares and 32,601 shares in 2011, 2010 and 2009, respectively, held in the Company’s non-qualied deferred compensation plan.
