Cash America 2010 Annual Report Download - page 6
Download and view the complete annual report
Please find page 6 of the 2010 Cash America annual report below. You can navigate through the pages in the report by either clicking on the pages listed below, or by using the keyword search tool below to find specific information within the annual report.-
 1
1 -
 2
2 -
 3
3 -
 4
4 -
 5
5 -
 6
6 -
 7
7 -
 8
8 -
 9
9 -
 10
10 -
 11
11 -
 12
12 -
 13
13 -
 14
14 -
 15
15 -
 16
16 -
 17
17 -
18
-
19
-
20
-
21
-
22
-
23
-
24
-
25
-
26
-
27
-
28
-
29
-
30
-
31
-
32
-
33
-
34
-
35
-
36
-
37
-
38
-
39
-
40
-
41
-
42
-
43
-
44
-
45
-
46
-
47
-
48
-
49
-
50
-
51
-
52
-
53
-
54
-
55
-
56
-
57
-
58
-
59
-
60
-
61
-
62
-
63
-
64
-
65
-
66
-
67
-
68
-
69
-
70
-
71
-
72
-
73
-
74
-
75
-
76
-
77
-
78
-
79
-
80
-
81
-
82
-
83
-
84
-
85
-
86
-
87
-
88
-
89
-
90
-
91
-
92
-
93
-
94
-
95
-
96
-
97
-
98
-
99
-
100
-
101
-
102
-
103
-
104
-
105
-
106
-
107
-
108
-
109
-
110
-
111
-
112
-
113
-
114
-
115
-
116
-
117
-
118
-
119
-
120
-
121
-
122
-
123
-
124
-
125
-
126
-
127
-
128
-
129
-
130
-
131
-
132
-
133
-
134
-
135
-
136
-
137
-
138
-
139
-
140
-
141
-
142
-
143
-
144
-
145
-
146
-
147
-
148
-
149
-
150
-
151
-
152
-
153
-
154
-
155
-
156
-
157
-
158
-
159
-
160
-
161
-
162
-
163
-
164
-
165
-
166
-
167
 |
 |

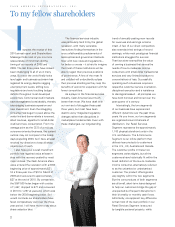
I suspect the receipt of this
2010 annual report and Shareholders
Message finds most of you in a more
relaxed state of mind than did the
timing of our reports of 2008 and
2009. The last three years have indeed
been challenging to all of us in many
ways. But now the world finally looks
level again and business optimism has
regained its energy despite nagging
unemployment levels, stifling new
regulations and very troubling budget
deficits throughout most developed
economies. Commercial credit markets
have strengthened considerably, thereby
encouraging business expansion and
new investment. Even the struggling
consumer has begun to peek above the
water line and demonstrate a renewed,
albeit cautious, appetite for small-dollar
credit and new consumption. From my
vantage point as the CEO of a mid cap
consumer-oriented business, the current
outlook may not compare to the heady
days preceding 2008, but I have at least
revoked my directive to keep all sharp
objects out of reach.
I also hope your overall investment
portfolio has regained value at least in
step with the recovery posted by most
major indices. The Cash America share
value entered the recession with a 2008
beginning price of approximately $31,
hit a three-year low of $12 in March of
2009 and recovered to approximately
$37 at the end of 2010. By comparison,
the S&P 500 Index began with a value
of 1,447, dropped to 677 and recovered
in 2010 to 1,257 at year-end, which was
below the 2008 beginning value. So I
would conclude our shareholders have
fared comparatively well over the three-
year period. I will have more to say about
share valuation later.
The financial services industry
was particularly hard hit by the global
recession, with many venerable
institutions finding themselves in the
once unfathomable predicaments of
bankruptcies and government bailouts.
Now with new rules and regulations –
for better or worse – it is hard to imagine
that most of these institutions will be
able to regain their previous positions
of prominence. A few of the most fit
and coddled will undoubtedly eclipse
their previous standing as they reap the
benefits of economic expansion with far
fewer competitors.
As a player in the financial services
industry, Cash America fared much
better than most. We have dealt with
our own set of struggles these past
three years, but most have been
dealt to us by misguided regulatory
changes rather than disruptions in
marketplace fundamentals. Even with
these challenges, our long-standing
trend of annually posting new records
for revenues and earnings remains
intact. A few of our direct competitors
also extended their strings of record
earnings, while most prestigious financial
institutions struggled for survival.
That fact alone exemplifies the value
of owning a business that serves the
needs of low-to-moderate income
consumers with small-dollar transactional
services and very limited exposure to
concentrations of loss. Successfully
operating such a business requires a
respectful customer service orientation,
disciplined execution and a resistance
to ideological assault…all principles we
have both honored and honed over the
past quarter of a century.
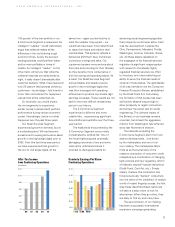
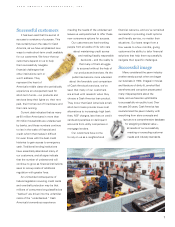
Interestingly, the two segments
of our business have experienced
different dynamics over the past three
years. As you know, our two segments
are organized around channels of
distribution. Our Retail Services
Segment represents the approximately
1,100 physical storefront units in the
U.S. and Mexico. The E-Commerce
Segment is our online platform that
delivers loan products to customers
in the U.S., UK, Australia and Canada.
The customer profile in these two
segments varies slightly, but all the
customers have historically fit within the
broad definition of the low-to-moderate
income consumer, alternatively referred
to as the unbanked or underbanked
customer. The product offerings also
vary slightly within the two segments.
But the core products of both segments
are all small, short-term loans designed
to help our customers bridge the gap of
unexpected but frequent disruptions in
their bi-weekly or monthly cash flows.
Admittedly, one apparent key difference
is that most of the loan portfolio in our
Retail Services Segment is secured
by tangible personal property, while
2