Cash America 2010 Annual Report Download - page 5
Download and view the complete annual report
Please find page 5 of the 2010 Cash America annual report below. You can navigate through the pages in the report by either clicking on the pages listed below, or by using the keyword search tool below to find specific information within the annual report.-
 1
1 -
 2
2 -
 3
3 -
 4
4 -
 5
5 -
 6
6 -
 7
7 -
 8
8 -
 9
9 -
 10
10 -
 11
11 -
 12
12 -
 13
13 -
 14
14 -
 15
15 -
 16
16 -
17
-
18
-
19
-
20
-
21
-
22
-
23
-
24
-
25
-
26
-
27
-
28
-
29
-
30
-
31
-
32
-
33
-
34
-
35
-
36
-
37
-
38
-
39
-
40
-
41
-
42
-
43
-
44
-
45
-
46
-
47
-
48
-
49
-
50
-
51
-
52
-
53
-
54
-
55
-
56
-
57
-
58
-
59
-
60
-
61
-
62
-
63
-
64
-
65
-
66
-
67
-
68
-
69
-
70
-
71
-
72
-
73
-
74
-
75
-
76
-
77
-
78
-
79
-
80
-
81
-
82
-
83
-
84
-
85
-
86
-
87
-
88
-
89
-
90
-
91
-
92
-
93
-
94
-
95
-
96
-
97
-
98
-
99
-
100
-
101
-
102
-
103
-
104
-
105
-
106
-
107
-
108
-
109
-
110
-
111
-
112
-
113
-
114
-
115
-
116
-
117
-
118
-
119
-
120
-
121
-
122
-
123
-
124
-
125
-
126
-
127
-
128
-
129
-
130
-
131
-
132
-
133
-
134
-
135
-
136
-
137
-
138
-
139
-
140
-
141
-
142
-
143
-
144
-
145
-
146
-
147
-
148
-
149
-
150
-
151
-
152
-
153
-
154
-
155
-
156
-
157
-
158
-
159
-
160
-
161
-
162
-
163
-
164
-
165
-
166
-
167
 |
 |

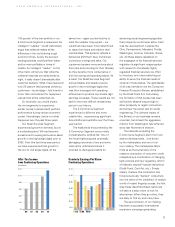
Total Revenue
(in millions)
$1,400
$1,200
$1,000
$800
$600
$400
$200
$0
1006 07 08 09
Income from Operations
(in millions)
$250
$200
$150
$100
$50
$0
1006 07 08 09
Earnings Per Share
$4.00
$3.50
$3.00
$2.50
$2.00
$1.50
$1.00
$0.50
$0.00
1006 07 08 09
Total Loans Written
to Customers*
(in billions)
*Includes loans funded by third parties
$4.0
$3.5
$3.0
$2.5
$2.0
$1.5
$1.0
$0.5
$0.0
1006 07 08 09
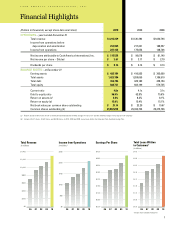
(Dollars in thousands, except share data and ratios) 2010 2009 2008
OPERATIONS – years ended December 31
Total revenue $1,293,339 $ 1,120,390 $ 1,030,794
Income from operations before
depreciation and amortization 251,055 217,241 188,357
Income from operations 207,132 175,652 148,706
Net income attributable to Cash America International, Inc. $ 115,538 $ 96,678 $ 81,140
Net income per share – Diluted $ 3.67 $ 3.17 $ 2.70
Dividends per share $ 0.14 $ 0.14 $ 0.14
BALANCE SHEETS – at December 31
Earning assets $ 482,184 $ 410,925 $ 362,090
Total assets 1,427,186 1,269,655 1,186,510
Total debt 456,704 429,183 438,154
Total equity 802,731 683,199 579,735
Current ratio 4.8x 4.1x 3.1x
Debt to equity ratio 56.9% 62.8% 75.6%
Return on assets (a) 8.8% 8.2% 8.1%
Return on equity (a) 15.6% 15.4% 15.1%
Net book value per common share outstanding $ 27.14 $ 23.29 $ 19.67
Common shares outstanding (b) 29,582,290 29,334,702 29,475,706
(a) Returns based on Net Income for the 12-month period divided by the monthly average of total assets and the monthly average of total equity of the Company.
(b) Includes 32,421 shares, 32,601 shares and 59,295 shares in 2010, 2009 and 2008, respectively, held in the Company’s Non-Qualified Savings Plan.
1