Cash America 2001 Annual Report Download - page 3
Download and view the complete annual report
Please find page 3 of the 2001 Cash America annual report below. You can navigate through the pages in the report by either clicking on the pages listed below, or by using the keyword search tool below to find specific information within the annual report.-
 1
1 -
 2
2 -
 3
3 -
 4
4 -
 5
5 -
 6
6 -
 7
7 -
 8
8 -
 9
9 -
 10
10 -
 11
11 -
 12
12 -
 13
13 -
 14
14 -
15
-
16
-
17
-
18
-
19
-
20
-
21
-
22
-
23
-
24
-
25
-
26
-
27
-
28
-
29
-
30
-
31
-
32
-
33
-
34
-
35
-
36
-
37
-
38
-
39
-
40
 |
 |

1
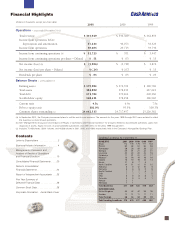
(Dollars in thousands, except per share data)
2001 2000 1999
Operations – years ended December 31 (a)
Total revenue $ 355,929 $ 346,360 $ 362,895
Income from operations before
depreciation and amortization 47,234 46,073 53,323
Income from operations 30,605 29,715 34,746
Income from continuing operations (b) $ 12,725 $ 701 $ 3,947
Income from continuing operations per share – Diluted $ .51 $ .03 $ .15
Net income (loss) (b) $ (5,906) $ (1,730) $ 3,876
Net income (loss) per share – Diluted $ (.24) $ (.07) $ .15
Dividends per share $ .05 $ .05 $ .05
Balance Sheets – at December 31
Earning assets $ 179,982 $ 176,799 $ 189,768
Total assets 382,890 378,233 417,623
Total debt 171,782 170,464 202,366
Stockholders’ equity 168,431 178,458 186,940
Current ratio 4.5x 6.9x 7.5x
Debt to equity ratio 102.0% 95.5% 108.3%
Common shares outstanding (c) 24,662,315 24,717,457 25,226,382
(a) In September 2001, the Company announced plans to exit the rent-to-own business. The amounts for the years 1999 through 2001 were restated to reflect
this business as discontinued operations.
(b) See “Management’s Discussion and Analysis of Results of Operations and Financial Condition” for amounts related to discontinued operations, gains from
disposals of assets, equity in losses of unconsolidated subsidiaries and other items for the years 1999 through 2001.
(c) Includes 70,469 shares, 59,611 shares, and 46,388 shares in 2001, 2000, and 1999, respectively, held in the Company’s Nonqualified Savings Plan.
Lending Locations As of December 31,
DOMESTIC 2001 2000 1999 1998 1997
Texas 174 178 179 177 144
Florida 62 62 61 60 58
Tennessee 28 28 28 28 22
Georgia 20 21 21 22 21
Louisiana 20 20 20 20 19
Oklahoma 17 21 21 21 17
Missouri 16 16 16 16 16
Indiana 13 16 16 14 14
Illinois 11 8 7 5
North Carolina 10 11 11 11 10
Alabama 9 9 10 10 9
Kentucky 9999 9
South Carolina 7778 7
Utah 7777 5
Ohio 6666 1
Colorado 5555 1
Kansas 2 1
Nebraska 1 1
Total Domestic 417 426 424 419 353
INTERNATIONAL
United Kingdom 45 42 42 39 38
Sweden 11 11 11 11 11
Total Foreign 56 53 53 50 49
Total Lending Locations 473 479 477 469 402
Financial Highlights
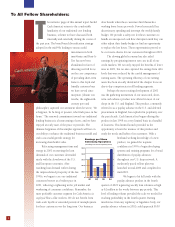
Letter to Shareholders . . . . . . . . . . . . . . 2
Business/Industry Information . . . . . . . . . 4
Management’s Discussion and
Analysis of Results of Operations
and Financial Condition . . . . . . . . . . . . 10
Consolidated Financial Statements . . . . 20
Notes to Consolidated
Financial Statements . . . . . . . . . . . . . . . 24
Report of Independent Accountants . . . 35
Five Year Summary of
Selected Financial Data . . . . . . . . . . . . 36
Common Stock Data . . . . . . . . . . . . . . . 36
Corporate Information . .Inside Back Cover
Contents