Cash America 2001 Annual Report Download - page 21
Download and view the complete annual report
Please find page 21 of the 2001 Cash America annual report below. You can navigate through the pages in the report by either clicking on the pages listed below, or by using the keyword search tool below to find specific information within the annual report.-
 1
1 -
2
-
3
-
4
-
5
-
6
-
7
-
8
-
9
-
10
-
 11
11 -
 12
12 -
 13
13 -
 14
14 -
 15
15 -
 16
16 -
 17
17 -
 18
18 -
 19
19 -
 20
20 -
 21
21 -
 22
22 -
 23
23 -
 24
24 -
 25
25 -
 26
26 -
 27
27 -
 28
28 -
 29
29 -
 30
30 -
 31
31 -
32
-
33
-
34
-
35
-
36
-
37
-
38
-
39
-
40
 |
 |

Management’s Discussion and Analysis of Results of Operations and Financial Condition
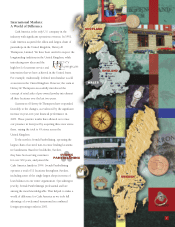
Foreign Lending Operations
(Dollars in thousands)
19
The following table sets forth selected consolidated financial data in U.S. dollars for Harvey & Thompson, Ltd. and Svensk Pantbelåning for the three years
ended December 31, 2001 using the following currency exchange rates:
2001 2000 1999
Harvey & Thompson, Ltd. (British pound sterling per U.S. dollar) —
Balance sheet data – end of period rate .6868 .6697 .6191
Statements of operations data – average rate for the period .6948 .6613 .6184
Svensk Pantbelåning (Swedish kronor per U.S. dollar) —
Balance sheet data – end of period rate 10.4425 9.4068 8.5030
Statements of operations data – average rate for the period 10.3427 9.1493 8.2647
REVENUE
Finance and service charges $ 21,176 $ 22,761 $ 25,646
Proceeds from disposition of merchandise 9,866 8,837 5,722
Check cashing fees 799 704 750
TOTAL REVENUE 31,841 32,302 32,118
Costs of Revenue
Disposed merchandise 7,307 8,107 4,739
NET REVENUE $ 24,534 $ 24,195 $ 27,379
Other Data
Net revenue contribution by source —
Finance and service charges 86.3% 94.1% 93.7%
Margin on disposition of merchandise 10.4% 3.0% 3.6%
Check cashing fees 3.3% 2.9% 2.7%
Expenses as a percentage of net revenue —
Operations and administration 56.1% 56.3% 48.8%
Depreciation and amortization 8.6% 8.1% 6.9%
Interest, net 2.9% 5.7% 4.9%
Income from operations as a percentage of total revenue 27.2% 26.7% 37.8%
Annualized yield on pawn loans 52.6% 49.0% 52.4%
Average pawn loan balance outstanding $ 40,266 $ 46,466 $ 48,915
Average pawn loan balance per average location in operation $ 746 $ 877 $ 959
Average pawn loan amount at year-end (not in thousands) $ 161 $ 168 $ 186
Margin on disposition of merchandise as a percentage
of proceeds from disposition of merchandise 25.9% 8.3% 17.2%
Average annualized merchandise turnover 2.5x 2.5x 2.0x
Average merchandise held for disposition per average location $ 54 $ 62 $ 46
Owned locations in operation —
Beginning of year 53 53 50
Acquired 3 — 2
Start-ups — — 1
End of year 56 53 53
Average number of owned locations in operation 54 53 51