Cash America 2001 Annual Report Download - page 19
Download and view the complete annual report
Please find page 19 of the 2001 Cash America annual report below. You can navigate through the pages in the report by either clicking on the pages listed below, or by using the keyword search tool below to find specific information within the annual report.-
 1
1 -
2
-
3
-
4
-
5
-
6
-
7
-
8
-
 9
9 -
 10
10 -
 11
11 -
 12
12 -
 13
13 -
 14
14 -
 15
15 -
 16
16 -
 17
17 -
 18
18 -
 19
19 -
 20
20 -
 21
21 -
 22
22 -
 23
23 -
 24
24 -
 25
25 -
 26
26 -
 27
27 -
 28
28 -
 29
29 -
30
-
31
-
32
-
33
-
34
-
35
-
36
-
37
-
38
-
39
-
40
 |
 |

17
(Dollars in thousands)
SUMMARY
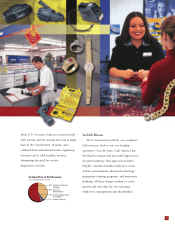
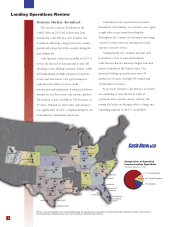
The Company expanded its lending operations during the three years ended December 31, 2001, by adding a net 4 locations. It acquired 10 operating
units, established 7 locations, and combined or closed 18 locations. In addition, 12 franchise units were opened, including 3 company owned locations
that were sold to a franchisee, and 4 units were closed. In September of 2001, the Company announced plans to exit the rent-to-own business. Therefore,
the net operating results, net assets and net cash flows of Rent-A-Tire, Inc. have been reported as “Discontinued Operations” in the accompanying financial
statements. See Note 3 of Notes to Consolidated Financial Statements. Selected consolidated and operations data for continuing operations for the three
years ended December 31, 2001, are presented below.
2001 2000 1999
REVENUE
Finance and service charges $ 113,863 $ 114,711 $ 123,111
Proceeds from disposition of merchandise 231,678 226,535 235,245
Other lending fees and royalties 6,194 1,233 129
Check cashing royalties and fees 4,194 3,881 4,410
TOTAL REVENUE 355,929 346,360 362,895
Costs of Revenue
Disposed merchandise 150,991 151,407 159,602
NET REVENUE $ 204,938 $ 194,953 $ 203,293
Other Data
Consolidated Operations:
Net revenue contribution by source —
Finance and service charges 55.6% 58.8% 60.5%
Margin on disposition of merchandise 39.4% 38.5% 37.2%
Other lending fees and royalties 3.0% 0.7% 0.1%
Check cashing royalties and fees 2.0% 2.0% 2.2%
Expenses as a percentage of net revenue —
Operations and administration 77.0% 76.4% 73.8%
Depreciation and amortization 8.1% 8.4% 9.1%
Interest, net 4.7% 6.7% 6.7%
Income from operations as a percentage of total revenue 8.6% 8.6% 9.6%
Lending Operations:
Pawn loans
Annualized yield on pawn loans 97.9% 94.8% 95.7%
Average pawn loan balance outstanding $ 116,368 $ 121,045 $ 128,636
Average pawn loan balance per average location in operation $ 253 $ 261 $ 277
Average pawn loan amount at year-end (not in thousands) $ 99 $ 101 $ 105
Margin on disposition of merchandise as a percentage
of proceeds from disposition of merchandise 34.8% 33.2% 32.2%
Average annualized merchandise turnover 2.6x 2.5x 2.4x
Average merchandise held for disposition per average location $ 128 $ 128 $ 145
Small consumer cash advances
Total amount of advances written (a) $ 49,003 $ 10,066 $ 3,223
Number of advances written (not in thousands) (a) 188,102 53,686 12,945
Average advance amount written (not in thousands) (a) $ 261 $ 187 $ 249
Average number of locations offering advances (not in thousands) (a) 356 123 9
Combined advances outstanding (a) $ 6,763 $ 1,636 $ 210
Advances outstanding before allowance for losses (b) $ 2,406 $ 1,054 $ 210
Owned locations in operation at end of year 460 463 466
Additional franchise locations at end of year 13 16 11
Total locations at end of year 473 479 477
Average number of owned locations in operation 460 464 465
Check Cashing Operations:
Check cashing royalties and fees $ 3,395 $ 3,177 $ 3,660
Franchised and owned check cashing centers —
Face amount of checks cashed $ 976,132 $ 910,239 $ 852,325
Gross fees collected $ 13,528 $ 12,400 $ 11,795
Average check cashed (not in thousands) $ 337 $ 327 $ 317
Centers in operation at end of year 134 132 137
Average centers in operation for the year 135 136 139
(a) Includes advances made by the Company and advances made by a third-party financial institution.
(b) Amounts recorded in the Company’s consolidated financial statements.
Management’s Discussion and Analysis of Results of Operations and Financial Condition