Cash America 2001 Annual Report Download - page 20
Download and view the complete annual report
Please find page 20 of the 2001 Cash America annual report below. You can navigate through the pages in the report by either clicking on the pages listed below, or by using the keyword search tool below to find specific information within the annual report.-
 1
1 -
2
-
3
-
4
-
5
-
6
-
7
-
8
-
9
-
 10
10 -
 11
11 -
 12
12 -
 13
13 -
 14
14 -
 15
15 -
 16
16 -
 17
17 -
 18
18 -
 19
19 -
 20
20 -
 21
21 -
 22
22 -
 23
23 -
 24
24 -
 25
25 -
 26
26 -
 27
27 -
 28
28 -
 29
29 -
 30
30 -
31
-
32
-
33
-
34
-
35
-
36
-
37
-
38
-
39
-
40
 |
 |

Management’s Discussion and Analysis of Results of Operations and Financial Condition
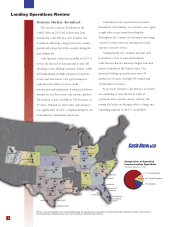
Domestic Lending Operations
(Dollars in thousands)
18
The following table sets forth selected financial data for the Company’s domestic lending operations for the three years ended December 31, 2001.
2001 2000 1999
REVENUE
Finance and service charges $ 92,687 $ 91,950 $ 97,465
Proceeds from disposition of merchandise 221,812 217,698 229,523
Other lending fees and royalties 6,194 1,233 129
TOTAL REVENUE 320,693 310,881 327,117
Costs of Revenue
Disposed merchandise 143,684 143,300 154,863
NET REVENUE $ 177,009 $ 167,581 $ 172,254
Other Data
Net revenue contribution by source —
Finance and service charges 52.4% 54.9% 56.6%
Margin on disposition of merchandise 44.1% 44.4% 43.3%
Other lending fees and royalties 3.5% 0.7% 0.1%
Expenses as a percentage of net revenue —
Operations and administration 80.2% 79.5% 75.9%
Depreciation and amortization 7.7% 8.2% 9.2%
Interest, net 2.5% 3.7% 5.3%
Income from operations as a percentage of total revenue 6.7% 6.7% 7.9%
Annualized yield on pawn loans 121.8% 123.3% 122.3%
Average pawn loan balance outstanding $ 76,102 $ 74,579 $ 79,721
Average pawn loan balance per average location in operation $ 187 $ 181 $ 193
Average pawn loan amount at year-end (not in thousands) $ 82 $ 83 $ 82
Margin on disposition of merchandise as a percentage
of proceeds from disposition of merchandise 35.2% 34.2% 32.5%
Average annualized merchandise turnover 2.6x 2.5x 2.4x
Average merchandise held for disposition per average location $ 138 $ 137 $ 157
Owned locations in operation —
Beginning of year 410 413 414
Acquired 2 — 3
Start-ups 21 3
Combined, closed or sold (10) (4) (7)
End of year 404 410 413
Additional franchise locations at end of year 13 16 11
Total locations at end of year 417 426 424
Average number of owned locations in operation 406 411 414