BP 2007 Annual Report Download - page 55
Download and view the complete annual report
Please find page 55 of the 2007 BP annual report below. You can navigate through the pages in the report by either clicking on the pages listed below, or by using the keyword search tool below to find specific information within the annual report.-
 1
1 -
2
-
3
-
4
-
5
-
6
-
7
-
8
-
9
-
10
-
11
-
12
-
13
-
14
-
15
-
16
-
17
-
18
-
19
-
20
-
21
-
22
-
23
-
24
-
25
-
26
-
27
-
28
-
29
-
30
-
31
-
32
-
33
-
34
-
35
-
36
-
37
-
38
-
39
-
40
-
41
-
42
-
43
-
44
-
 45
45 -
 46
46 -
 47
47 -
 48
48 -
 49
49 -
 50
50 -
 51
51 -
 52
52 -
 53
53 -
 54
54 -
 55
55 -
 56
56 -
 57
57 -
 58
58 -
 59
59 -
 60
60 -
 61
61 -
 62
62 -
 63
63 -
 64
64 -
 65
65 -
66
-
67
-
68
-
69
-
70
-
71
-
72
-
73
-
74
-
75
-
76
-
77
-
78
-
79
-
80
-
81
-
82
-
83
-
84
-
85
-
86
-
87
-
88
-
89
-
90
-
91
-
92
-
93
-
94
-
95
-
96
-
97
-
98
-
99
-
100
-
101
-
102
-
103
-
104
-
105
-
106
-
107
-
108
-
109
-
110
-
111
-
112
-
113
-
114
-
115
-
116
-
117
-
118
-
119
-
120
-
121
-
122
-
123
-
124
-
125
-
126
-
127
-
128
-
129
-
130
-
131
-
132
-
133
-
134
-
135
-
136
-
137
-
138
-
139
-
140
-
141
-
142
-
143
-
144
-
145
-
146
-
147
-
148
-
149
-
150
-
151
-
152
-
153
-
154
-
155
-
156
-
157
-
158
-
159
-
160
-
161
-
162
-
163
-
164
-
165
-
166
-
167
-
168
-
169
-
170
-
171
-
172
-
173
-
174
-
175
-
176
-
177
-
178
-
179
-
180
-
181
-
182
-
183
-
184
-
185
-
186
-
187
-
188
-
189
-
190
-
191
-
192
-
193
-
194
-
195
-
196
-
197
-
198
-
199
-
200
-
201
-
202
-
203
-
204
-
205
-
206
-
207
-
208
-
209
-
210
-
211
-
212
 |
 |

BP ANNUAL REPORT AND ACCOUNTS 2007 53
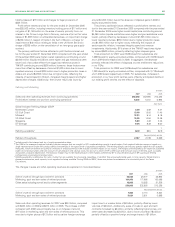
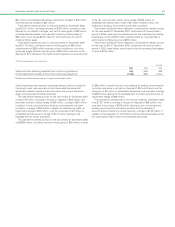
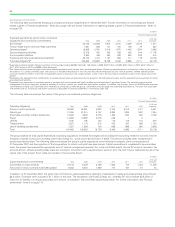
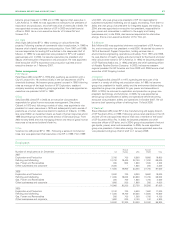
Environmental expenditure
$million
------------------------------------------------------------------------------------------------------------------------------------------------
2007 2006 2005
------------------------------------------------------------------------------------------------------------------------------------------------
Operating expenditure 662 596 494
Clean-ups 62 59 43
Capital expenditure 1,033 806 789
Additions to environmental
remediation provision 373 423 565
Additions to decommissioning
provision 1,163 2,142 1,023
Operating and capital expenditure on the prevention, control, abatement
or elimination of air, water and solid waste pollution is often not incurred
as a separately identifiable transaction. Instead, it forms part of a larger
transaction that includes, for example, normal maintenance expenditure.
The figures for environmental operating and capital expenditure in the
table are therefore estimates, based on the definitions and guidelines of
the American Petroleum Institute.
The increase in environmental operating expenditure in 2007
compared with 2006 is primarily due to increased integrity management
activity and activity associated with the implementation of the Baker
Panel recommendations. The increase in environmental operating
expenditure in 2006 compared with 2005 is largely related to expenditure
incurred on reducing air emissions at US refineries. Similar levels of
operating and capital expenditures are expected in the foreseeable
future. In addition to operating and capital expenditures, we also create
provisions for future environmental remediation. Expenditure against
such provisions is normally in subsequent periods and is not included in
environmental operating expenditure reported for such periods. The
charge for environmental remediation provisions in 2007 includes
$339 million resulting from a reassessment of existing site obligations
and $34 million in respect of provisions for new sites.
Provisions for environmental remediation are made when a clean-up is
probable and the amount reasonably determinable. Generally, their timing
coincides with commitment to a formal plan of action or, if earlier, on
divestment or on closure of inactive sites.
The extent and cost of future remediation programmes are inherently
difficult to estimate. They depend on the scale of any possible
contamination, the timing and extent of corrective actions and also the
group’s share of liability. Although the cost of any future remediation
could be significant and may be material to the result of operations in the
period in which it is recognized, we do not expect that such costs will
have a material effect on the group’s financial position or liquidity. We
believe our provisions are sufficient for known requirements; we do not
believe that our costs will differ significantly from those of other
companies engaged in similar industries, or that our competitive position
will be adversely affected as a result.
In addition, we make provisions on installation of our oil- and gas-
producing assets and related pipelines to meet the cost of eventual
decommissioning. On installation of an oil or natural gas production
facility a provision is established that represents the discounted value of
the expected future cost of decommissioning the asset. Additionally, we
undertake periodic reviews of existing provisions. These reviews take
account of revised cost assumptions, changes in decommissioning
requirements and any technological developments. The level of increase
in the decommissioning provision varies with the number of new fields
coming onstream in a particular year and the outcome of the periodic
reviews.
Provisions for environmental remediation and decommissioning are
usually set up on a discounted basis, as required by IAS 37 ‘Provisions,
Contingent Liabilities and Contingent Assets’.
Further details of decommissioning and environmental provisions
appear in Financial statements – Note 37 on page 151. See also
Environment on page 41.
Suppliers and contractors
Our processes are designed to enable us to choose suppliers carefully
on merit, avoiding conflicts of interest and inappropriate gifts and
entertainment. We expect suppliers to comply with legal requirements
and we seek to do business with suppliers who act in line with BP’s
commitments to compliance and ethics, as outlined in the code of
conduct. We engage with suppliers in a variety of ways, including
performance review meetings to identify mutually advantageous
ways to improve performance.
Creditor payment policy and practice
Statutory regulations issued under the UK Companies Act 1985 require
companies to make a statement of their policy and practice in respect of
the payment of trade creditors. In view of the international nature of the
group’s operations there is no specific group-wide policy in respect of
payments to suppliers. Relationships with suppliers are, however,
governed by the group’s policy commitment to long-term relationships
founded on trust and mutual advantage. Within this overall policy,
individual operating companies are responsible for agreeing terms and
conditions for their business transactions and ensuring that suppliers are
awareofthetermsofpayment.
Contributing to communities
We make direct contributions to communities through community
programmes. Our total contribution in 2007 was $135.8 million. This
includes $0.7 million contributed by BP to UK charities. The growing
focus of this is on education, the development of local enterprise and
providing access to energy in remote locations.
In 2007, we spent $77.7 million promoting education, with investment
in three broad areas: energy and the environment; business leadership
skills; and basic education in developing countries where we operate
large projects.