BP 2007 Annual Report Download - page 19
Download and view the complete annual report
Please find page 19 of the 2007 BP annual report below. You can navigate through the pages in the report by either clicking on the pages listed below, or by using the keyword search tool below to find specific information within the annual report.-
 1
1 -
2
-
3
-
4
-
5
-
6
-
7
-
8
-
 9
9 -
 10
10 -
 11
11 -
 12
12 -
 13
13 -
 14
14 -
 15
15 -
 16
16 -
 17
17 -
 18
18 -
 19
19 -
 20
20 -
 21
21 -
 22
22 -
 23
23 -
 24
24 -
 25
25 -
 26
26 -
 27
27 -
 28
28 -
 29
29 -
30
-
31
-
32
-
33
-
34
-
35
-
36
-
37
-
38
-
39
-
40
-
41
-
42
-
43
-
44
-
45
-
46
-
47
-
48
-
49
-
50
-
51
-
52
-
53
-
54
-
55
-
56
-
57
-
58
-
59
-
60
-
61
-
62
-
63
-
64
-
65
-
66
-
67
-
68
-
69
-
70
-
71
-
72
-
73
-
74
-
75
-
76
-
77
-
78
-
79
-
80
-
81
-
82
-
83
-
84
-
85
-
86
-
87
-
88
-
89
-
90
-
91
-
92
-
93
-
94
-
95
-
96
-
97
-
98
-
99
-
100
-
101
-
102
-
103
-
104
-
105
-
106
-
107
-
108
-
109
-
110
-
111
-
112
-
113
-
114
-
115
-
116
-
117
-
118
-
119
-
120
-
121
-
122
-
123
-
124
-
125
-
126
-
127
-
128
-
129
-
130
-
131
-
132
-
133
-
134
-
135
-
136
-
137
-
138
-
139
-
140
-
141
-
142
-
143
-
144
-
145
-
146
-
147
-
148
-
149
-
150
-
151
-
152
-
153
-
154
-
155
-
156
-
157
-
158
-
159
-
160
-
161
-
162
-
163
-
164
-
165
-
166
-
167
-
168
-
169
-
170
-
171
-
172
-
173
-
174
-
175
-
176
-
177
-
178
-
179
-
180
-
181
-
182
-
183
-
184
-
185
-
186
-
187
-
188
-
189
-
190
-
191
-
192
-
193
-
194
-
195
-
196
-
197
-
198
-
199
-
200
-
201
-
202
-
203
-
204
-
205
-
206
-
207
-
208
-
209
-
210
-
211
-
212
 |
 |

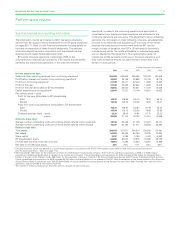
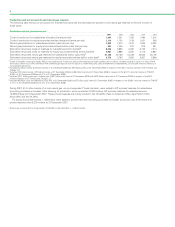
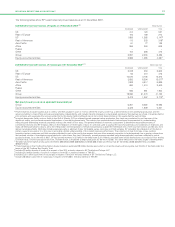
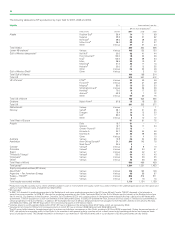
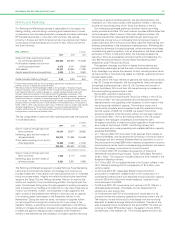
The following tables show BP’s estimated net proved reserves as at 31 December 2007.
Estimated net proved reserves of liquids at 31 December 2007abc million barrels
--------------------------------------------------------------------------------------------------------------------------------------------------------------------------------------------------------------------------------------------------------------------------------------------------------
Developed Undeveloped Total
--------------------------------------------------------------------------------------------------------------------------------------------------------------------------------------------------------------------------------------------------------------------------------------------------------
UK 414 123 537
Rest of Europe 105 169 274
US 1,882 1,265 3,147d
Rest of Americas 115 203 318e
Asia Pacific 61 77 138
Africa 256 350 606
Russia ––
Other 104 368 472
--------------------------------------------------------------------------------------------------------------------------------------------------------------------------------------------------------------------------------------------------------------------------------------------------------
Group 2,937 2,555 5,492
--------------------------------------------------------------------------------------------------------------------------------------------------------------------------------------------------------------------------------------------------------------------------------------------------------
Equity-accounted entities 2,996 1,585 4,581f
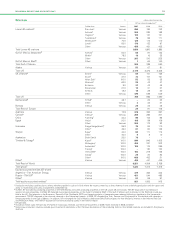
Estimated net proved reserves of natural gas at 31 December 2007abc billion cubic feet
--------------------------------------------------------------------------------------------------------------------------------------------------------------------------------------------------------------------------------------------------------------------------------------------------------
Developed Undeveloped Total
--------------------------------------------------------------------------------------------------------------------------------------------------------------------------------------------------------------------------------------------------------------------------------------------------------
UK 2,049 553 2,602
Rest of Europe 63 410 473
US 10,670 4,705 15,375
Rest of Americas 3,683 8,394 12,077g
Asia Pacific 1,822 4,817 6,639
Africa 990 1,410 2,400
Russia ––
Other 583 981 1,564
--------------------------------------------------------------------------------------------------------------------------------------------------------------------------------------------------------------------------------------------------------------------------------------------------------
Group 19,860 21,270 41,130
--------------------------------------------------------------------------------------------------------------------------------------------------------------------------------------------------------------------------------------------------------------------------------------------------------
Equity-accounted entities 2,473 1,297 3,770h
Net proved reserves on an oil equivalent basis (mmboe)
Group 6,361 6,222 12,583
Equity-accounted entities 3,422 1,809 5,231
aProved reserves exclude royalties due to others, whether payable in cash or in kind, where the royalty owner has a direct interest in the underlying production and the
option and ability to make lifting and sales arrangements independently, and include minority interests in consolidated operations. We disclose our share of reserves held in
joint ventures and associates that are accounted for by the equity method although we do not control these entities or the assets held by such entities.
bIn certain deepwater fields, such as fields in the Gulf of Mexico, BP has claimed proved reserves before production flow tests are conducted, in part because of the
significant safety, cost and environmental implications of conducting these tests. The industry has made substantial technological improvements in understanding,
measuring and delineating reservoir properties without the need for flow tests. The general method of reserves assessment to determine reasonable certainty of
commercial recovery that BP employs relies on the integration of three types of data: (1) well data used to assess the local characteristics and conditions of reservoirs and
fluids; (2) field scale seismic data to allow the interpolation and extrapolation of these characteristics outside the immediate area of the local well control; and (3) data from
relevant analogous fields. Well data includes appraisal wells or sidetrack holes, full logging suites, core data and fluid samples. BP considers the integration of this data in
certain cases to be superior to a flow test in providing a better understanding of the overall reservoir performance. The collection of data from logs, cores, wireline
formation testers, pressures and fluid samples calibrated to each other and to the seismic data can allow reservoir properties to be determined over a greater volume than
the localized volume of investigation associated with a short-term flow test. Historically, proved reserves recorded using these methods have been validated by actual
production levels. As at the end of 2007, BP had proved reserves in 22 fields in the deepwater Gulf of Mexico that had been initially booked prior to production flow testing.
Of these fields, 19 are in production and one, Thunder Horse, is expected to begin production by the end of 2008. Two other fields are in the early stages of development.
cThe 2007 year-end marker prices used were Brent $96.02/bbl (2006 $58.93/bbl and 2005 $58.21/bbl) and Henry Hub $7.10/mmBtu (2006 $5.52/mmBtu and 2005
$9.52/mmBtu).
dProved reserves in the Prudhoe Bay field in Alaska include an estimated 98 million barrels upon which a net profits royalty will be payable over the life of the field under the
terms of the BP Prudhoe Bay Royalty Trust.
eIncludes 20 million barrels of crude oil in respect of the 30% minority interest in BP Trinidad and Tobago LLC.
fIncludes 210 million barrels of crude oil in respect of the 6.51% minority interest in TNK-BP.
gIncludes 3,211 billion cubic feet of natural gas in respect of the 30% minority interest in BP Trinidad and Tobago LLC.
hIncludes 68 billion cubic feet of natural gas in respect of the 5.88% minority interest in TNK-BP.
–
–
BP ANNUAL REPORT AND ACCOUNTS 2007 17