BP 2007 Annual Report Download - page 52
Download and view the complete annual report
Please find page 52 of the 2007 BP annual report below. You can navigate through the pages in the report by either clicking on the pages listed below, or by using the keyword search tool below to find specific information within the annual report.-
 1
1 -
2
-
3
-
4
-
5
-
6
-
7
-
8
-
9
-
10
-
11
-
12
-
13
-
14
-
15
-
16
-
17
-
18
-
19
-
20
-
21
-
22
-
23
-
24
-
25
-
26
-
27
-
28
-
29
-
30
-
31
-
32
-
33
-
34
-
35
-
36
-
37
-
38
-
39
-
40
-
41
-
 42
42 -
 43
43 -
 44
44 -
 45
45 -
 46
46 -
 47
47 -
 48
48 -
 49
49 -
 50
50 -
 51
51 -
 52
52 -
 53
53 -
 54
54 -
 55
55 -
 56
56 -
 57
57 -
 58
58 -
 59
59 -
 60
60 -
 61
61 -
 62
62 -
63
-
64
-
65
-
66
-
67
-
68
-
69
-
70
-
71
-
72
-
73
-
74
-
75
-
76
-
77
-
78
-
79
-
80
-
81
-
82
-
83
-
84
-
85
-
86
-
87
-
88
-
89
-
90
-
91
-
92
-
93
-
94
-
95
-
96
-
97
-
98
-
99
-
100
-
101
-
102
-
103
-
104
-
105
-
106
-
107
-
108
-
109
-
110
-
111
-
112
-
113
-
114
-
115
-
116
-
117
-
118
-
119
-
120
-
121
-
122
-
123
-
124
-
125
-
126
-
127
-
128
-
129
-
130
-
131
-
132
-
133
-
134
-
135
-
136
-
137
-
138
-
139
-
140
-
141
-
142
-
143
-
144
-
145
-
146
-
147
-
148
-
149
-
150
-
151
-
152
-
153
-
154
-
155
-
156
-
157
-
158
-
159
-
160
-
161
-
162
-
163
-
164
-
165
-
166
-
167
-
168
-
169
-
170
-
171
-
172
-
173
-
174
-
175
-
176
-
177
-
178
-
179
-
180
-
181
-
182
-
183
-
184
-
185
-
186
-
187
-
188
-
189
-
190
-
191
-
192
-
193
-
194
-
195
-
196
-
197
-
198
-
199
-
200
-
201
-
202
-
203
-
204
-
205
-
206
-
207
-
208
-
209
-
210
-
211
-
212
 |
 |

50
Sales and other operating revenues for 2006 was $233 billion, and net gains of $177 million principally on the divestment of a number
compared with $213 billion in 2005 and $171 billion in 2004. The increase of regional retail networks in the US, and is after a charge of $700 million
in 2006 compared with 2005 was principally due to an increase of around related to the March 2005 incident at the Texas City refinery, a charge of
$23 billion in marketing, spot and term sales of refined products. This $140 million relating to new, and revisions to existing, environmental and
was due to higher prices of $25 billion, partially offset by lower volumes other provisions, an impairment charge of $93 million and a charge of
of $2 billion. Additionally, sales of crude oil, spot and term contracts $33 million for the impairment of an equity-accounted entity.
increased by $2 billion, reflecting higher prices of $6 billion and lower During 2007, the segment continued to focus on the restoration of
volumes of $4 billion, and other sales decreased by $5 billion, primarily operations at the Texas City refinery and on investments in integrity
due to lower volumes. management throughout our refining portfolio. We have also focused on
Profit before interest and tax for the year ended 31 December 2007 the repair and recommissioning of the Whiting refinery following the
was $6,072 million, including net disposal gains of $1,151 million operational issues in March 2007. In many parts of the refining portfolio
(primarily related to the sale of BP’s Coryton refinery in the UK, its and the other market-facing businesses, we delivered high reliability and
interest in the West Texas pipeline system in the US and its interest in improved results compared with 2006. However, for the full year,
the Samsung Petrochemical Company in South Korea) and inventory compared with 2006, the impact of the outages and recommissioning
holding gains of $3,455 million; and was after impairment charges of costs at the Texas City and Whiting refineries, as well as investments in
$1,186 million (primarily related to the sale of the majority of our US integrity management and scheduled turnarounds throughout our refining
Convenience Retail business, a write-down of certain assets at our portfolio, reduced the result by around $1,600 million, cost inflation
Hull site and a write-down of our Mexico retail assets), a charge of reduced the result by around $100 million and lower results from supply
$500 million related to the March 2005 Texas City refinery incident, a optimization decreased the result by around $1,500 million. These factors
charge of $138 million relating to new, and revisions to existing, more than offset increased margins in both refining and marketing that
environmental and other provisions, a restructuring charge of $118 contributed around $1,150 million.
million, a charge of $91 million in respect of a donation to the BP In comparison with the year ended 31 December 2005, profit before
Foundation and a charge of $70 million related to the reassessment of interest and tax for the year ended 31 December 2006 reflected higher
certain provisions. refining margins (including the benefit of supply optimization), which
Profit before interest and tax for the year ended 31 December 2006 contributed around $900 million, higher retail margins by around
was $5,041 million, including net disposal gains of $884 million (related $600 million (although this was partially offset by a deterioration of
primarily to the sale of BP’s Czech Republic retail business, the disposal around $150 million in other marketing margins) and lower costs
of BP’s shareholding in Zhenhai Refining and Chemicals Company, the associated with rationalization programmes of around $320 million.
sale of BP’s shareholding in Eiffage, the French-based construction There was a reduction of around $1.1 billion due to the impact of the
company, and pipelines assets), and was after inventory holding losses progressive recommissioning of Texas City during the year. Efficiency
of $242 million, a charge of $925 million related to the March 2005 programmes delivered lower operating costs although the savings were
incident at the Texas City refinery, an impairment charge of $155 million, offset by higher turnaround and integrity management spend.
a charge of $155 million in respect of a donation to the BP Foundation The average refining Global Indicator Margin (GIM) in 2007 was higher
and a charge of $33 million relating to new, and revisions to existing, than in 2006.
environmental and other provisions. Refining throughputs in 2007 were 2,127mb/d, 71mb/d lower than in
Profit before interest and tax for the year ended 31 December 2005 2006. Refining availability was 82.9%, broadly consistent with 2006.
was $6,926 million, including inventory holding gains of $2,532 million Marketing volumes at 3,806mb/d were around 2% lower than in 2006.
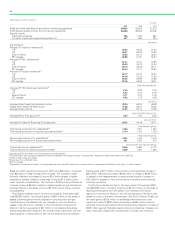
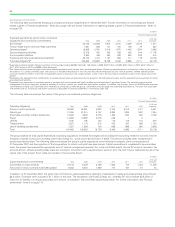
Gas, Power and Renewables
$ million
--------------------------------------------------------------------------------------------------------------------------------------------------------------------------------------------------------------------------------------------------------------------------------------------------------
2007 2006 2005
--------------------------------------------------------------------------------------------------------------------------------------------------------------------------------------------------------------------------------------------------------------------------------------------------------
Sales and other operating revenues from continuing operations 21,369 23,708 25,696
Profit before interest and tax from continuing operationsa674 1,321 1,172
aIncludes profit after interest and tax of equity-accounted entities.
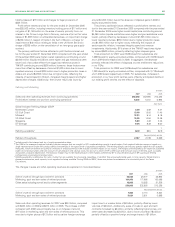
The changes in sales and other operating revenues are explained in more detail below.
$ million
--------------------------------------------------------------------------------------------------------------------------------------------------------------------------------------------------------------------------------------------------------------------------------------------------------
2007 2006 2005
--------------------------------------------------------------------------------------------------------------------------------------------------------------------------------------------------------------------------------------------------------------------------------------------------------
Gas marketing sales 8,639 11,428 15,222
Other sales (including NGL marketing) 12,730 12,280 10,474
--------------------------------------------------------------------------------------------------------------------------------------------------------------------------------------------------------------------------------------------------------------------------------------------------------
21,369 23,708 25,696
million cubic feet per day
--------------------------------------------------------------------------------------------------------------------------------------------------------------------------------------------------------------------------------------------------------------------------------------------------------
2007 2006 2005
--------------------------------------------------------------------------------------------------------------------------------------------------------------------------------------------------------------------------------------------------------------------------------------------------------
Gas marketing sales volumes 3,382 3,685 5,096
Natural gas sales by Exploration and Production 4,414 5,152 4,747
Sales and other operating revenues for 2007 was $21 billion, compared $4.2 billion related to lower volumes, partially offset by an increase of
with $24 billion in 2006. Gas marketing sales decreased by $2.8 billion $0.4 billion related to higher prices. Other sales (including NGLs
reflecting a decrease of $0.9 billion related to lower volumes and a marketing) increased by $1.8 billion due to higher prices. Gas marketing
decrease of $1.9 billion related to lower prices. Other sales (including sales volumes declined in 2007 and 2006 primarily due to customer
NGLs marketing) increased by $0.5 billion, reflecting an increase of portfolio changes.
$0.8 billion related to higher prices, partially offset by a decrease of Profit before interest and tax for the year ended 31 December 2007
$0.3 billion related to lower volumes. Sales and other operating revenues was $674 million, including inventory holding gains of $116 million and
were $24 billion in 2006, compared with $26 billion in 2005. Gas net disposal gains of $12 million; and was after a net fair value charge of
marketing sales declined by $3.8 billion, reflecting a decrease of