Amtrak 2012 Annual Report Download - page 7
Download and view the complete annual report
Please find page 7 of the 2012 Amtrak annual report below. You can navigate through the pages in the report by either clicking on the pages listed below, or by using the keyword search tool below to find specific information within the annual report.-
 1
1 -
 2
2 -
 3
3 -
 4
4 -
 5
5 -
 6
6 -
 7
7 -
 8
8 -
 9
9 -
 10
10 -
 11
11 -
 12
12 -
 13
13 -
 14
14 -
 15
15 -
 16
16 -
 17
17 -
 18
18 -
19
-
20
-
21
-
22
-
23
-
24
-
25
-
26
-
27
-
28
-
29
-
30
-
31
-
32
-
33
-
34
-
35
-
36
-
37
-
38
-
39
-
40
-
41
-
42
-
43
-
44
-
45
-
46
-
47
-
48
-
49
-
50
-
51
-
52
-
53
-
54
-
55
-
56
-
57
-
58
-
59
-
60
-
61
-
62
-
63
-
64
-
65
-
66
-
67
-
68
-
69
-
70
-
71
-
72
-
73
-
74
-
75
-
76
-
77
-
78
-
79
-
80
-
81
-
82
-
83
-
84
-
85
-
86
-
87
-
88
-
89
-
90
-
91
-
92
-
93
-
94
-
95
-
96
-
97
 |
 |

to be used past its normal operating life results in higher maintenance costs, lower reliability and reduced
equipment availability which negatively impacts on-time performance and other key operating metrics.
The need to invest in capital programs beyond federal support levels has caused the company to begin
funding certain critical projects by reducing operating costs and allocating revenue to continue critical
capital programs. As Table 1 indicates, Amtrak’ s FY2012 budget designates $121 million of revenue to
be used to fund capital projects. Such use of revenue is only made possible by reductions of operating
costs by a similar amount, and accordingly this budget reflects actions that are discussed later in this
document.
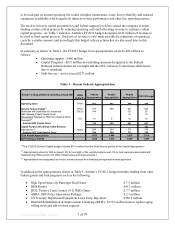
In summary as shown in Table 1, the FY2012 budget from appropriations totals $1,409 million as
follows:
Operating support - $466 million
Capital Programs - $671 million not including amounts designated to the Federal
Railroad Administration for oversight and the NEC Advisory Commission (differences
due to rounding)
Debt Service – not to exceed $271 million.
Table 1 – Recent Federal Appropriations
PRIIA
A
uthorit
y
Operating Grant 101(a) 563 562 466 345
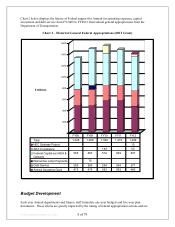
General Federal Ca
p
ital(1) 101(c) 574 649 607 623
219 (b) 144 50 50
NEC Gateway Project Capital Funds 15 15
Plus amount Retained by FRA from Capital & DS for
Oversight(2) 103 10 9 10 10
Subtotal DOT Capital Grant 728 658 681 697
Capital Funded with Amtrak Ticket Revenue 121
102(a) 264 264 271 255
Subtotal DOT Debt Service Grant 264 264 271 255
1,555 1,484 1,418 1,418
1,545 1,474 1,409 1,409
FY2010
Ap pr opri at io n FY2012 Budget
(1)This FY2012 General Capital budget includes $16.5 million from the Debt Service portion of the Capital Appropriation
Amtrak Funding ($millions) excluding Amtrak OIG FY2012
Ap pro pri at io n
(2) Appropriations allow for FRA to deduct .5% for oversight of the capital programs and .5% to fund expenses associated with
implementing PRIIA section 212 (NEC Infrastructure and Improvements.)
FY2011
Appropriation
Net Funding to Amtrak
Americans with Disabilities Act Investment
Debt Service (3)
(3) Appropriations are designated as a not to exceed amount for scheduled principal and interest payments.
Total Amtrak Appropriation
In addition to the appropriations shown in Table 1, Amtrak’ s FY2012 budget includes funding from other
federal grants and loan programs such as the following:
High Speed Inter-city Passenger Rail Grant: $ 7.3 million
DHS Grants: $41.1 million
DOT, Positive Train Control (V-ETMS) Grant: $ 7.7 million
ARRA 2009 Police Operations Package: $ 2.1 million
US Treasury Department Equipment Lease Early Buy-Outs: $258.8 million.
FY2012 Budget Post Board 1.20.12.doc 7 of 79
Railroad Rehabilitation & Improvement Financing (RRIF): $119.6 million loan to replace aging
rolling stock and add revenue capacity.