Amtrak 2012 Annual Report Download - page 13
Download and view the complete annual report
Please find page 13 of the 2012 Amtrak annual report below. You can navigate through the pages in the report by either clicking on the pages listed below, or by using the keyword search tool below to find specific information within the annual report.-
 1
1 -
2
-
 3
3 -
 4
4 -
 5
5 -
 6
6 -
 7
7 -
 8
8 -
 9
9 -
 10
10 -
 11
11 -
 12
12 -
 13
13 -
 14
14 -
 15
15 -
 16
16 -
 17
17 -
 18
18 -
 19
19 -
 20
20 -
 21
21 -
 22
22 -
 23
23 -
24
-
25
-
26
-
27
-
28
-
29
-
30
-
31
-
32
-
33
-
34
-
35
-
36
-
37
-
38
-
39
-
40
-
41
-
42
-
43
-
44
-
45
-
46
-
47
-
48
-
49
-
50
-
51
-
52
-
53
-
54
-
55
-
56
-
57
-
58
-
59
-
60
-
61
-
62
-
63
-
64
-
65
-
66
-
67
-
68
-
69
-
70
-
71
-
72
-
73
-
74
-
75
-
76
-
77
-
78
-
79
-
80
-
81
-
82
-
83
-
84
-
85
-
86
-
87
-
88
-
89
-
90
-
91
-
92
-
93
-
94
-
95
-
96
-
97
 |
 |

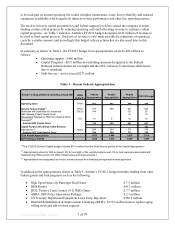
Table 4 – Profit and Loss Statement
FY10 FY11 FY12
$ millions
Actual Actual Budget $%
REVENUES:
Passen
g
er Related:
Ticket Revenue 1,702.1 1,851.5 1,967.9 116.4 6.3%
Food and Beverage 97.5 109.4 109.3 (0.1) -0.1%
State Supported Train Revenue 174.3 191.1 192.9 1.8 0.9%
Subotal Passenger Related Revenue 1,973.9 2,152.0 2,270.1 118.0 5.5%
Commuter 152.5 173.4 140.0 (33.4) -19.3%
Reimbursable 100.7 84.1 103.0 18.9 22.4%
Commercial Development 74.8 76.2 71.8 (4.4) -5.8%
Other Transportation 135.6 139.5 143.3 3.8 2.7%
Freight Access Fees and Other 47.0 50.6 59.0 8.3 16.5%
Subtotal Other Revenue 510.5 523.8 517.0 (6.8) -1.3%
Total Operating Revenue 2,484.4 2,675.9 2,787.1 111.2 4.2%
Salaries, Wages and Benefits:
Salaries 239.1 258.3 263.5 (5.2) -2.0%
Wages & Overtime 941.8 1,008.5 998.1 10.4 1.0%
Employee Benefits 534.9 609.9 600.1 9.8 1.6%
Employee Related 26.1 33.3 27.6 5.6 16.9%
Salaries, Wages and Benefits 1,741.9 1,909.9 1,889.3 20.6 1.1%
Train Operations 262.4 253.6 271.8 (18.2) -7.2%
Fuel, Power, & Utilities 299.7 337.9 369.5 (31.6) -9.4%
Materials 184.2 191.7 200.6 (8.9) -4.6%
Facility, Communication, & Office 178.0 172.5 176.6 (4.0) -2.3%
Advertising and Sales 113.7 112.9 80.4 32.5 28.8%
Depreciation 602.5 602.6 671.4 (68.8) -11.4%
Other Non-labor Fees and Services 177.1 210.6 208.0 2.5 1.2%
Total Expenses 3,559.6 3,791.7 3,867.6 (75.9) -2.0%
Operating Loss (1,075.2) (1,115.9) (1,080.5) 35.4 3.2%
Post Retirement (OPEB's) 79.1 61.8 102.5 2.0 3.2%
Pay-As-You-Go Offset (OPEB) (26.4) (38.7)
Depreciation 602.5 602.6 671.4 68.8 11.4%
Adj for Non-Cash Depreciation/OPEBs/Impairment
655.2 664.4 735.2 70.8 10.7%
Net Operating Loss (419.9) (451.5) (345.3) 106.2 23.5%
Federal Appropriation/PRIIA Authorized 563.0 561.9 466.0 (95.9) -17.1%
Over/(Under) Federal Support (143.1) (110.4) (120.7)
FY12 Fav/(Unfav) to FY1
1
This income statement represents the total federal support required for Amtrak operations. This is not a GAAP financial statement.
As compared to a GAAP financial statement, this income statement excludes costs for Amtrak's Office of the Inspector General
(funded independently), non-capitalizable costs and state contributions associated with capital projects (funded by capital
appropriation), and net interest expense (funded by debt service appropriation).
FY2012 Operating Budget Assumptions
Revenue
FY2012 Budget Post Board 1.20.12.doc 13 of 79
Passenger Revenue, including ticket sales, was developed with the assistance of an outside firm. The
consultant employs a complex model that takes into account numerous factors such as population growth,
shifts, and preferences, travel industry competition including the price of gasoline, economic conditions,
service schedules, and proposed pricing actions.