Amtrak 2012 Annual Report Download - page 3
Download and view the complete annual report
Please find page 3 of the 2012 Amtrak annual report below. You can navigate through the pages in the report by either clicking on the pages listed below, or by using the keyword search tool below to find specific information within the annual report.-
 1
1 -
 2
2 -
 3
3 -
 4
4 -
 5
5 -
 6
6 -
 7
7 -
 8
8 -
 9
9 -
 10
10 -
 11
11 -
 12
12 -
 13
13 -
 14
14 -
15
-
16
-
17
-
18
-
19
-
20
-
21
-
22
-
23
-
24
-
25
-
26
-
27
-
28
-
29
-
30
-
31
-
32
-
33
-
34
-
35
-
36
-
37
-
38
-
39
-
40
-
41
-
42
-
43
-
44
-
45
-
46
-
47
-
48
-
49
-
50
-
51
-
52
-
53
-
54
-
55
-
56
-
57
-
58
-
59
-
60
-
61
-
62
-
63
-
64
-
65
-
66
-
67
-
68
-
69
-
70
-
71
-
72
-
73
-
74
-
75
-
76
-
77
-
78
-
79
-
80
-
81
-
82
-
83
-
84
-
85
-
86
-
87
-
88
-
89
-
90
-
91
-
92
-
93
-
94
-
95
-
96
-
97
 |
 |

Tables and Charts
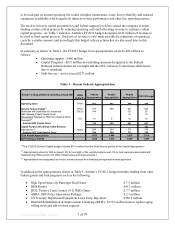
Table 1 – Recent Federal Appropriations ....................................................................................... 7
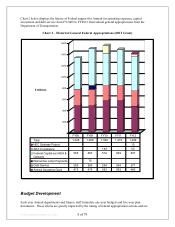
Chart 2 – Historical General Federal Appropriations (DOT Grant) ............................................... 8
Table 3 – New Activities and Initiatives....................................................................................... 10
Table 4 – Profit and Loss Statement............................................................................................. 13
Table 5 – Summary of Changes in Operating Revenue................................................................ 15
Chart 6 – Ridership Trends........................................................................................................... 16
Chart 7 – Ticket, Food and Beverage Revenue Trends ................................................................ 16
Table 8 – Reconciliation of FY12 Operating Expense Budget to FY11 Expenses ...................... 18
Chart 9 – Salaries, Wages, Taxes and Benefits ............................................................................ 20
Chart 10 – Diesel Fuel .................................................................................................................. 21
Chart 11 – Fuel, Power and Utilities............................................................................................. 22
Table 12 – Summary Capital Programs........................................................................................ 23
Table 13 – Summary FY2012 Capital Program Budget by Department (millions) ..................... 23
Table 14 - Rolling Stock Counts & Availability (includes Funded State Corridor Growth) ....... 26
Table 15 – State of Good Repair Funding Plan ............................................................................ 28
Table 16 - Debt Service ................................................................................................................ 30
Table 17 – Leases in Treasury MOU – Early Buyout Options..................................................... 31
Table 18 – Simple Sources and Uses............................................................................................ 32
Appendices
Summary Income Statement by Major Account
Summary Income Statement by Department and Major Account
Revenue and Expenses by Department
Summary Income Statement for Commuter Business Line
Summary Income Statement for Commercial Development Business Line
Summary Income Statement by Major Account and Activity
Reconciliation of FY12 Operating Budget to FY11 Operating Budget
Monthly Average and End of Year Headcount by Department
Summary Capital Programs
FY2012 Capital Budget Ranking
Summary Metrics FY2009-FY2012
Route Level Metrics
FY2012 Budget Post Board 1.20.12.doc 3 of 79