Alpine 2010 Annual Report Download - page 3
Download and view the complete annual report
Please find page 3 of the 2010 Alpine annual report below. You can navigate through the pages in the report by either clicking on the pages listed below, or by using the keyword search tool below to find specific information within the annual report.-
 1
1 -
 2
2 -
 3
3 -
 4
4 -
 5
5 -
 6
6 -
 7
7 -
 8
8 -
 9
9 -
 10
10 -
 11
11 -
 12
12 -
 13
13 -
 14
14 -
15
-
16
-
17
-
18
-
19
-
20
-
21
-
22
-
23
-
24
-
25
-
26
-
27
-
28
-
29
-
30
-
31
-
32
-
33
-
34
-
35
-
36
-
37
-
38
 |
 |

3
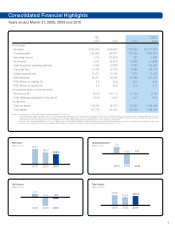
Consolidated Financial Highlights
For the year
Net sales
Overseas sales
Operating income
Net income
Cash flows from operating activities
Free cash flow
Capital expenditures
R&D expenses
ROA (Return on assets) (%)
ROE (Return on equity) (%)
Amounts per share of common stock
Net income (¥)
Cash dividends applicable to the year (¥)
At year-end
Total net assets
Total assets
2009
¥196,667
166,873
(10,645)
(9,291)
10,680
(2,170)
10,160
28,266
(6.2)
(8.8)
(133.17)
10.00
96,874
132,423
2008
¥252,072
219,056
7,012
3,554
9,963
(4,138)
13,673
29,337
2.0
3.0
50.95
25.00
116,265
167,785
millions
of yen
2010
$1,811,973
1,486,834
2,440
(13,435)
105,965
63,370
47,066
221,292
(0.9)
(1.3)
(0.19)
0.00
1,042,949
1,649,065
thousands of
U.S.Dollars
2010
¥168,586
138,335
227
(1,250)
9,859
5,896
4,379
20,589
(0.9)
(1.3)
(17.92)
0.00
97,036
153,429
1. R&D expenses include labor and other expenses reported as cost of sales.
2. Total shareholders' equity and total assets for 2000 are reclassified to conform to the "Standard for Accounting for Transactions by Foreign Currency, etc." effective from the year ended March 31, 2001.
Accordingly, ROA and ROE for 2000 are recalculated. With the standard adopted prior to 2001, total shareholders' equity, total assets and shareholders' equity per share of common stock for 2000 were
¥58,533 million, ¥121,694 million and ¥1,019.91, respectively. Also, ROA, ROE and equity ratio for 2000 were 2.6%, 5.7% and 48.1%, respectively.
3. Effective from the year ended March 31, 2007, the Company and its consolidated subsidiaries adopted the new accounting standard for presentation of net assets ("Accounting Standard for Presentation
of Net Assets in the Balance Sheet and its Implementation Guidance" issued by the Business Accounting Deliberation Council on December 9, 2005).
Notes:
Years ended March 31, 2008, 2009 and 2010
Net Sales
(Billions of yen)
2008 2009 2010
168.6
196.7
252.1
Total Assets
(Billions of yen)
153.4
132.4
167.8
2008 2009 2010
Net Income
(Billions of yen)
-1.3
-9.3
3.6
2008 2009 2010
Operating Income
(Billions of yen)
0.2
-10.6
7.0
2008 2009 2010