Alpine 2010 Annual Report Download - page 15
Download and view the complete annual report
Please find page 15 of the 2010 Alpine annual report below. You can navigate through the pages in the report by either clicking on the pages listed below, or by using the keyword search tool below to find specific information within the annual report.-
 1
1 -
2
-
3
-
4
-
 5
5 -
 6
6 -
 7
7 -
 8
8 -
 9
9 -
 10
10 -
 11
11 -
 12
12 -
 13
13 -
 14
14 -
 15
15 -
 16
16 -
 17
17 -
 18
18 -
 19
19 -
 20
20 -
 21
21 -
 22
22 -
 23
23 -
 24
24 -
 25
25 -
26
-
27
-
28
-
29
-
30
-
31
-
32
-
33
-
34
-
35
-
36
-
37
-
38
 |
 |

15
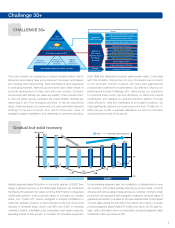
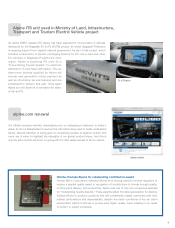
The European and U.S. after-markets faced exacting conditions, despite market launches of
car navigation systems and integrated information and communication equipment from the
second half of the year, because of market stagnation, exacerbated by intensified competition
arising from the widespread adoption of portable navigation devices (PNDs) and smart
phones equipped with navigation functions.
Brand-name products for automobile manufacturers evidenced initial signs of recovery,
despite moderate sales of luxury and larger cars with high factory installation rates for
navigation systems in the North American and Chinese markets. This, however, was
insufficient to offset poor first-half sales performance.
As a result of the above factors, segment sales decreased by 9.4% year on year, to ¥98.1
billion (US$ 1,054.6 million).
As a result of activities to improve the profitability, the Company achieved the profit for the
2nd half six-month results. However, taken effect by the lower sales in the 1st half, the
consolidated net sales, operating income and net loss stood at ¥168.6 billion (US$1,812.0
million) , ¥0.2 billion (US$2.4 million) and ¥1.3 billion (US$13.4 million) respectively for the year
ended March 31, 2010.
The number of consolidated subsidiaries is 27 companies, with 8 companies in Japan and 19
overseas. The number of companies accounted for by the equity method at the end of the
fiscal year is 1.
Investment
Capital expenditures decreased by 56.9% to ¥4,379 million (US$47.1 million). By segment,
investment in the Audio Products business totaled ¥2,085 million (US$22.4 million), and
that in the Information and Communication Equipment business amounted to ¥2,288 million
(US$24.6 million).
R&D expenses decreased by 27.2% to ¥20,589 million (US$221.3 million). R&D expenses
amounted to 12.2% of net sales, down 2.2 percentage points.
Cash Flows
For the fiscal year under review, cash and cash equivalents at the end of the period totaled
¥39,844 million (US$428.2 million), a increase of ¥13,703 million (US$147.3 million), or 52.4%,
compared with the previous fiscal year-end.
Cash flows from operating activities
Net cash provided by operating activities amounted to ¥9,859 million (US$106.0 million),
a decrease of 7.7%. This was mainly the result of inflows provided by depreciation and
amortization of ¥8,352 million (US$ 89.8 million), increase in notes and accounts payable-
trade of ¥10,973 million (US$117.9 million), decrease in inventories of ¥1,129 million (US$12.1
million), increase in notes and accounts receivable-trade of ¥10,845 million (US$116.6 million).
Cash flows from investing activities
Net cash used in investing activities was ¥3,963 million (US$42.6 million), down 69.2%
compared with the previous fiscal year. Principal components were payments for the
acquisition of tangible and intangible fixed assets of ¥2,998 million (US$32.2 million) and
¥1,222 million (US$13.1 million), respectively.
Cash flows from financing activities
Net cash provided by financing activities totaled ¥8,150 million (US$87.6 million), compared
to the net cash used of ¥329 million in the previous fiscal year. The principal component
was proceeds from long-term loans payable of ¥10,002 million (US$107.5 million) and net
decrease in short-term loans payable of ¥1,594 million (US$17.1 million).
Financial Position
Total assets at the end of the year increased by 15.9% to ¥153,429 million (US$1,649.1
million), due to an increase in cash and cash equivalents, notes and accounts receivable-
trade, and investments, and due to a decrease in inventories, property, plant and equipment.
As a result of the increase in valuation difference on available-for-sale securities and decrease
in foreign currency translation adjustment, total net assets increased by 0.2% to ¥97,036
million (US$1,042.9 million). The equity ratio decreased by 9.7 percentage points to 62.7%.
Return on equity was -1.3%. Return on assets was -0.9%.
Cash Flows
(Millions of yen)
2006
3,032
2007 2008
9,859
2009
12,887
5,896
2010
16,399
4,512
9,963
(4,138)
10,680
(2,170)
Cash Flows from Operating Activity
Free Cash Flow
Return on Equity/Return on Assets
(%)
2006
3.8
2007 2008
(0.9)
2009
6.2
(1.3)
2010
5.0
3.3
(6.2)
3.0
(8.8)
2.0
Return on Equity
Ruturn on Assets
Cash Dividends
(¥)
2006
10.0
2007 2008
20.0
0.0
2009 2010
25.025.0