Alpine 2010 Annual Report Download - page 12
Download and view the complete annual report
Please find page 12 of the 2010 Alpine annual report below. You can navigate through the pages in the report by either clicking on the pages listed below, or by using the keyword search tool below to find specific information within the annual report.-
 1
1 -
 2
2 -
 3
3 -
 4
4 -
 5
5 -
 6
6 -
 7
7 -
 8
8 -
 9
9 -
 10
10 -
 11
11 -
 12
12 -
 13
13 -
 14
14 -
 15
15 -
 16
16 -
 17
17 -
 18
18 -
 19
19 -
 20
20 -
 21
21 -
 22
22 -
23
-
24
-
25
-
26
-
27
-
28
-
29
-
30
-
31
-
32
-
33
-
34
-
35
-
36
-
37
-
38
 |
 |

12
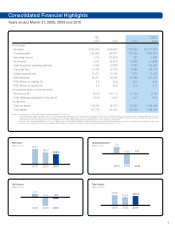
Millions of Yen, unless stated otherwise
2000 2001 2002 2003 2004 2005
For the year:
Net sales 171,084 181,615 196,092 222,367 213,020 222,779
(Overseas Sales) 123,893 129,522 157,032 177,017 170,984 180,828
Operating income(loss) 6,298 4,445 7,022 12,306 11,320 10,148
Net income(loss) 3,098 3,284 3,914 6,138 7,253 7,932
Net cash provided by
operating activities 4,622 1,921 15,728 14,389 10,491 12,472
Free cash flow 3,100 (3,602) 8,513 6,290 3,021 3,229
Depreciation 5,338 5,385 5,552 5,723 6,496 7,332
Capital expenditures 5,607 6,307 6,808 8,218 8,940 10,402
R&D expenses 10,990 12,628 14,718 17,644 19,144 22,438
ROA (Return on assets) (%) 2.6 2.7 2.8 4.1 4.9 5.3
ROE (Return on equity) (%) 5.9 5.4 5.6 8.3 9.4 9.4
At year-end:
Current assets 81,400 85,046 102,396 106,180 99,031 105,372
Property, plant and equipment 22,810 23,649 22,466 22,898 22,714 25,544
Current liabilities 56,092 53,094 55,754 58,669 48,681 50,826
Noncurrent liabilities 6,005 6,403 17,944 15,869 15,534 15,807
Capital stock 18,090 19,928 19,928 20,012 20,026 20,360
Retained earnings 23,365 26,002 29,247 34,393 40,500 47,275
Total shareholders' equity 54,940 67,145 72,467 74,738 80,336 88,830
Total net assets — — — — — —
Total assets 118,101 127,772 147,412 150,230 145,127 156,507
Equity ratio (%) 46.5 52.6 49.2 49.8 55.4 56.7
Amounts per share of common stock:
Net income(loss) (¥) 54.74 56.40 64.49 99.78 117.94 128.97
Diluted net income (¥) 52.04 54.60 — 86.86 102.85 112.58
Dividends from surplus
applicable to the year (¥) 10.00 10.00 12.50 17.50 17.50 20.00
Shareholders' equity (¥) 957.30 1,106.38 1,194.19 1,227.79 1,319.41 1,446.99
Notes: 1. R&D expenses include labor and other expenses reported as cost of sales.
2. Total shareholders' equity and total assets for 2000 are reclassified to conform to the "Standard for Accounting for Transactions by Foreign Currency,
etc." effective from the year ended March 31, 2001. Accordingly, ROA and ROE for 2000 are recalculated. With the standard adopted prior to 2001,
total shareholders' equity, total assets and shareholders' equity per share of common stock for 2000 were ¥58,533 million, ¥121,694 million and
¥1,019.91, respectively. Also, ROA, ROE and equity ratio for 2000 were 2.6%, 5.7% and 48.1%, respectively.
Financial Highlights