Allegheny Power 2015 Annual Report Download - page 2
Download and view the complete annual report
Please find page 2 of the 2015 Allegheny Power annual report below. You can navigate through the pages in the report by either clicking on the pages listed below, or by using the keyword search tool below to find specific information within the annual report.-
 1
1 -
 2
2 -
 3
3 -
 4
4 -
 5
5 -
 6
6 -
 7
7 -
 8
8 -
 9
9 -
 10
10 -
 11
11 -
 12
12 -
 13
13 -
14
-
15
-
16
-
17
-
18
-
19
-
20
-
21
-
22
-
23
-
24
-
25
-
26
-
27
-
28
-
29
-
30
-
31
-
32
-
33
-
34
-
35
-
36
-
37
-
38
-
39
-
40
-
41
-
42
-
43
-
44
-
45
-
46
-
47
-
48
-
49
-
50
-
51
-
52
-
53
-
54
-
55
-
56
-
57
-
58
-
59
-
60
-
61
-
62
-
63
-
64
-
65
-
66
-
67
-
68
-
69
-
70
-
71
-
72
-
73
-
74
-
75
-
76
-
77
-
78
-
79
-
80
-
81
-
82
-
83
-
84
-
85
-
86
-
87
-
88
-
89
-
90
-
91
-
92
-
93
-
94
-
95
-
96
-
97
-
98
-
99
-
100
-
101
-
102
-
103
-
104
-
105
-
106
-
107
-
108
-
109
-
110
-
111
-
112
-
113
-
114
-
115
-
116
-
117
-
118
-
119
-
120
-
121
-
122
-
123
-
124
-
125
-
126
-
127
-
128
-
129
-
130
-
131
-
132
-
133
-
134
-
135
-
136
-
137
-
138
-
139
-
140
-
141
-
142
-
143
-
144
-
145
-
146
-
147
-
148
-
149
-
150
-
151
-
152
-
153
-
154
-
155
-
156
-
157
-
158
-
159
-
160
-
161
-
162
-
163
 |
 |

0 400 500 600100 300200
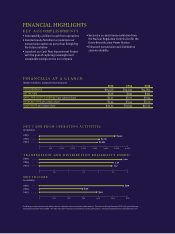
FINANCIAL HIGHLIGHTS
KEY ACCOMPLISHMENTS
• Generated $3.4 billion in cash from operations
• Invested nearly $1 billion to modernize our
transmission system as part of our Energizing
the Future initiative
• Launched our Cash Flow Improvement Project
with the goal of capturing meaningful and
sustainable savings across our company
• Secured a 20-year license extension from
the Nuclear Regulatory Commission for the
Davis-Besse Nuclear Power Station
• Enhanced transmission and distribution
system reliability
FINANCIALS AT A GLANCE
(dollars in millions, except per share amounts)
2015 2014 2013
TOTAL REVENUES $15,026 $15,049 $14,892
NET INCOME $578 $299 $392
BASIC AND DILUTED EARNINGS per common share $1.37 $0.71 $0.94
DIVIDENDS PAID per common share $1.44 $1.44 $2.20
BOOK VALUE per common share $29.33 $29.49 $30.32
NET INCOME
(in millions)
2015
2014
2013 $392
TRANSMISSION AND DISTRIBUTION RELIABILITY INDEX*
2015
2014
2013
2.56
2.47
2.80
$299
$578
* FirstEnergy’s index comprises two indices that are commonly used in the electric utility industry: Transmission Outage Frequency (TOF) and System Average
Interruption Duration Index (SAIDI). Our index measures frequency and duration of service interruptions: the better the performance, the higher the score.
NET CASH FROM OPERATING ACTIVITIES
(in millions)
2015
2014
2013
$2,713
$2,662
$3,447
0 2,000 2,500 4,000500 1,000 1,500 3,000 3,500
0 2 2.5 30.5 1 1.5