Access America 2006 Annual Report Download - page 27
Download and view the complete annual report
Please find page 27 of the 2006 Access America annual report below. You can navigate through the pages in the report by either clicking on the pages listed below, or by using the keyword search tool below to find specific information within the annual report.
Annual Report 2006 25
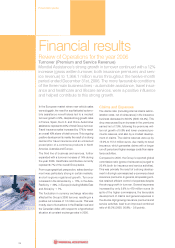
Investments and financial results
At December 31st, 2006 the Group’s financial
investments amounted to 550.0 million euros (2005:
538.3 million euros). The relatively high amount of
cash and cash equivalents of 218 million euros
(+ 37.1%) is caused by the positive cash flow in
2006 and the inverse yield curve in the UK, leading
our subsidiary to invest in short-term papers which
are accounted for as cash.
The investments and financial results are com-
posed of three parts. First, the result from invest-
ments decreased to 14.0 million euros (2005:
15.0 million euros) as the investments from current
income were lower and the realised losses on
securities available for sale slightly increased.
Second, unrealised gains and losses on exchange
rates amounted to a loss of 1.1 million euros (2005:
gain of 3.5 million euros) due to the strong re-eval-
uation of the US dollar against the Swiss franc.
And third, the interest and similar result increased
to 13.4 million euros compared to 9.9 million euros
in the previous year. This increase was mainly due
to a higher investment portfolio on short-term
deposits, cash and cash equivalents. In total, the
described effects slightly decreased the invest-
ment and financial result to 26.2 million euros
(2005: 28.4 million euros).
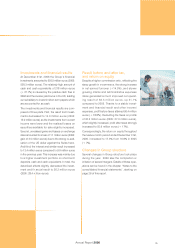
Result before and after tax,
and return on equity
Despite a higher commission ratio, reflecting the
steep growth in e-commerce, the strong increase
in net earned turnover (+14.5%), and slower
growing claims and administrative expenses
ratios generated a much improved net operat-
ing result of 63.5 million euros, up 31.1%
compared to 2005. Thanks to a stable invest-
ment and financial result and other income/
expenses, profit before taxes attained 90.4 million
euros (+ 18.8%). Deducting the taxes on profits
of 33.3 million euros (2005: 27.0 million euros),
which slightly increased, profit after taxes strongly
increased to 55.9 million euros (+ 17%).
Correspondingly, the return on equity throughout
the twelve-month period ended December 31st,
2006, increased to 17.9% from 16.8% in 2005
(+ 7%).
Changes in Group structure
Several changes in Group structure took place
during the year. 2006 saw the completion or
initiation of several mergers. Details of these oper-
ations can be found in the chapter “Notes to the
consolidated financial statements”, starting on
page 26 of this report.


