Whirlpool 2013 Annual Report Download - page 6
Download and view the complete annual report
Please find page 6 of the 2013 Whirlpool annual report below. You can navigate through the pages in the report by either clicking on the pages listed below, or by using the keyword search tool below to find specific information within the annual report.-
 1
1 -
 2
2 -
 3
3 -
 4
4 -
 5
5 -
 6
6 -
 7
7 -
 8
8 -
 9
9 -
 10
10 -
 11
11 -
 12
12 -
 13
13 -
 14
14 -
 15
15 -
 16
16 -
 17
17 -
18
-
19
-
20
-
21
-
22
-
23
-
24
-
25
-
26
-
27
-
28
-
29
-
30
-
31
-
32
-
33
-
34
-
35
-
36
-
37
-
38
-
39
-
40
-
41
-
42
-
43
-
44
-
45
-
46
-
47
-
48
-
49
-
50
-
51
-
52
 |
 |

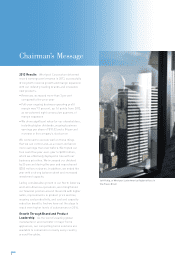
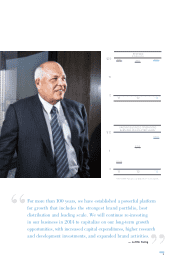
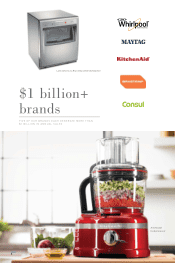
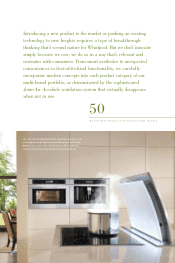
We invested $1.1 billion in capital, research and
development in 2013. Our enhanced product
development and delivery capabilities drove
50 major launches in 2013, and we were recognized
around the globe for our craftsmanship, innovation
and quality.
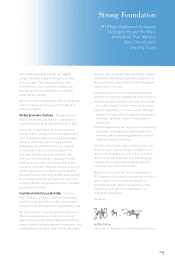
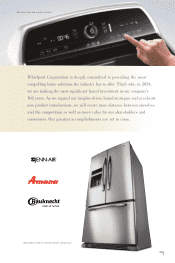
on being the best in the industry at understanding
consumers’ needs and desires, and we are using
our deep insights to exceed their expectations
through our winning products and industry-leading
brands. Consumers showed strong preference for
our distinctive offerings, which resulted not only
in higher global sales, but also greater overall
levels of profitability for our company.
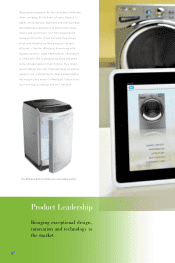
We demonstrated leadership in environmental
sustainability with appliances that conform to the
highest standards of energy and water efficiency
without compromising performance. And we
continued our focus on leveraging our core
appliance expertise to further develop our newer
categories, like our water business.
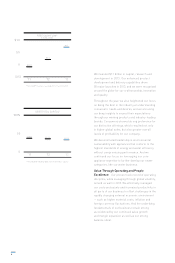
Value Through Operating and People
Excellence Our proven track record of operating
discipline, while managing through global volatility,
served us well in 2013. We effectively managed
our costs and assets and increased productivity in
all parts of our business to offset challenges in the
rapidly changing external economic environment
— such as higher material costs, inflation and
foreign currency fluctuations. And the underlying
fundamentals of our business remain strong
as evidenced by our continued sales growth
and margin expansion as well as our strong
balance sheet.
**
36.8% 33.0%
36.0%
*
$ IN BILLIONS
’09 ’10 ’13’11 ’12
$(0.1)
$0.7
$0.2
’11 ’13’12
’11 ’13’12
0
0.5
$1.0
(0.5)
50
100%
0
4