Whirlpool 2013 Annual Report Download - page 40
Download and view the complete annual report
Please find page 40 of the 2013 Whirlpool annual report below. You can navigate through the pages in the report by either clicking on the pages listed below, or by using the keyword search tool below to find specific information within the annual report.-
 1
1 -
2
-
3
-
4
-
5
-
6
-
7
-
8
-
9
-
10
-
11
-
12
-
13
-
14
-
15
-
16
-
17
-
18
-
19
-
20
-
21
-
22
-
23
-
24
-
25
-
26
-
27
-
28
-
29
-
 30
30 -
 31
31 -
 32
32 -
 33
33 -
 34
34 -
 35
35 -
 36
36 -
 37
37 -
 38
38 -
 39
39 -
 40
40 -
 41
41 -
 42
42 -
 43
43 -
 44
44 -
 45
45 -
 46
46 -
 47
47 -
 48
48 -
 49
49 -
 50
50 -
51
-
52
 |
 |

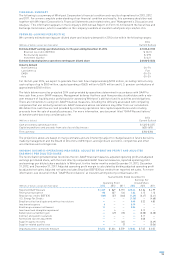
WHIRLPOOL CORPORATION
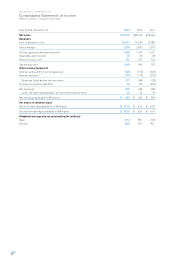
Consolidated Statements of Income
(Millions of dollars, except per share data)
Year Ended December 31, 2013 2012 2011
Net sales $ 18,769 $ 18,143 $ 18,666
Expenses
Cost of products sold 15,471 15,250 16,089
Gross margin 3,298 2,893 2,577
Selling, general and administrative 1,828 1,757 1,621
Intangible amortization 25 30 28
Restructuring costs 196 237 136
Operating profit 1,249 869 792
Other income (expense)
Interest and sundry income (expense) (155) (112) (607)
Interest expense (177) (199) (213)
Earnings (loss) before income taxes 917 558 (28)
Income tax expense (benefit) 68 133 (436)
Net earnings 849 425 408
Less: Net earnings available to noncontrolling interests 22 24 18
Net earnings available to Whirlpool $ 827 $ 401 $ 390
Per share of common stock
Basic net earnings available to Whirlpool $ 10.42 $ 5.14 $ 5.07
Diluted net earnings available to Whirlpool $ 10.24 $ 5.06 $ 4.99
Weighted-average shares outstanding (in millions)
Basic 79.3 78.1 76.8
Diluted 80.8 79.3 78.1
38