Whirlpool 2013 Annual Report Download - page 43
Download and view the complete annual report
Please find page 43 of the 2013 Whirlpool annual report below. You can navigate through the pages in the report by either clicking on the pages listed below, or by using the keyword search tool below to find specific information within the annual report.-
 1
1 -
2
-
3
-
4
-
5
-
6
-
7
-
8
-
9
-
10
-
11
-
12
-
13
-
14
-
15
-
16
-
17
-
18
-
19
-
20
-
21
-
22
-
23
-
24
-
25
-
26
-
27
-
28
-
29
-
30
-
31
-
32
-
 33
33 -
 34
34 -
 35
35 -
 36
36 -
 37
37 -
 38
38 -
 39
39 -
 40
40 -
 41
41 -
 42
42 -
 43
43 -
 44
44 -
 45
45 -
 46
46 -
 47
47 -
 48
48 -
 49
49 -
 50
50 -
 51
51 -
 52
52
 |
 |

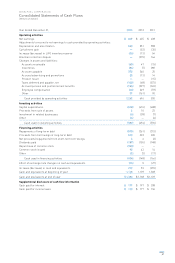
WHIRLPOOL CORPORATION
Consolidated Statements of Cash Flows
(Millions of dollars)
Year Ended December 31, 2013 2012 2011
Operating activities
Net earnings $ 849 $ 425 $ 408
Adjustments to reconcile net earnings to cash provided by operating activities:
Depreciation and amortization 540 551 558
Curtailment gain —(52) (35)
Increase (decrease) in LIFO inventory reserve (26) (13) 54
Brazilian collection dispute —(275) 144
Changes in assets and liabilities:
Accounts receivable (65) 47 (15)
Inventories (86) (7) 283
Accounts payable 275 240 25
Accrued advertising and promotions 28 (13) 14
Product recall —— (15)
Taxes deferred and payable, net (105) (68) (573)
Accrued pension and postretirement benefits (184) (227) (349)
Employee compensation (23) 249 (59)
Other 59 (161) 90
Cash provided by operating activities 1,262 696 530
Investing activities
Capital expenditures (578) (476) (608)
Proceeds from sale of assets 610 23
Investment in related businesses (6) (28) (7)
Other (4) — (4)
Cash used in investing activities (582) (494) (596)
Financing activities
Repayments of long-term debt (513) (361) (313)
Proceeds from borrowings of long-term debt 518 322 300
Net proceeds (repayments) from short-term borrowings 56 (2)
Dividends paid (187) (155) (148)
Repurchase of common stock (350) — —
Common stock issued 95 43 14
Other (2) (3) (17)
Cash used in financing activities (434) (148) (166)
Effect of exchange rate changes on cash and equivalents (34) 5 (27)
Increase (decrease) in cash and equivalents 212 59 (259)
Cash and equivalents at beginning of year 1,168 1,109 1,368
Cash and equivalents at end of year $ 1,380 $ 1,168 $ 1,109
Supplemental disclosure of cash flow information
Cash paid for interest $ 179 $ 197 $ 208
Cash paid for income taxes $ 158 $ 177 $ 136
41