Whirlpool 2012 Annual Report Download - page 31
Download and view the complete annual report
Please find page 31 of the 2012 Whirlpool annual report below. You can navigate through the pages in the report by either clicking on the pages listed below, or by using the keyword search tool below to find specific information within the annual report.-
 1
1 -
2
-
3
-
4
-
5
-
6
-
7
-
8
-
9
-
10
-
11
-
12
-
13
-
14
-
15
-
16
-
17
-
18
-
19
-
20
-
 21
21 -
 22
22 -
 23
23 -
 24
24 -
 25
25 -
 26
26 -
 27
27 -
 28
28 -
 29
29 -
 30
30 -
 31
31 -
 32
32 -
 33
33 -
 34
34 -
 35
35 -
 36
36 -
 37
37 -
 38
38 -
 39
39 -
 40
40 -
 41
41 -
42
-
43
-
44
-
45
-
46
 |
 |

29
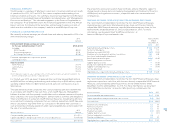
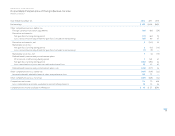
FINANCIAL SUMMARY
The following is a summary of Whirlpool Corporation’s financial condition and results
of operations for 2012, 2011 and 2010. For a more complete understanding of our
financial condition and results, this summary should be read together with Whirlpool
Corporation’s Consolidated Finan cial Statements and related notes, and “Management’s
Discussion and Analysis.” This information appears in the Financial Supplement to
the Company’s Proxy Statement and in the Financial Supplement to the 2012 Annual
Report on Form 10-K filed with the Securities and Exchange Commission, both of
which are also available on the company’s website at www.WhirlpoolCorp.com.
FORWARD-LOOKING PERSPECTIVE
We currently estimate earnings per diluted share and industry demand for 2013 to be
within the following ranges:
2013
Outlook
Estimated GAAP diluted earnings per share,
for the year ending December 31, 2013 $9.80–$10.30
Including:
BEFIEX credits $(0.81)
Restructuring expense $1.75
U.S. Energy Tax Credits(1) $(1.50)
Estimated ongoing business operations diluted
earnings per share $9.25–$9.75
Industry demand
North America 2%–3%
Latin America 3%–5%
EMEA 0%–0%
Asia 3%–5%
(1) 2013 Outlook includes the expected impact of the U.S. Energy Tax Credits earned in 2012 and 2013. The
benefit earned for both years will be recognized in 2013.
For the full-year 2013, we expect to generate free cash flow between $600 million
and $650 million, including restructuring cash outlays of up to $245 million, capital
spending of $600 million to $650 million and U.S. pension contributions of up to
$140 million.
The table below reconciles projected 2013 cash provided by operations determined
in accordance with GAAP to free cash flow, a non-GAAP measure. Management
believes that free cash flow provides stockholders with a relevant measure of liquidity
and a useful basis for assessing Whirlpool’s ability to fund its activities and obligations.
There are limitations to using non-GAAP financial measures, including the difficulty
associated with comparing companies that use similarly named non-GAAP measures
whose calculations may differ from our calculations. We define free cash flow as
cash provided by continuing operations after capital expenditures and proceeds from
the sale of assets/businesses.
(Billions of dollars)
2013
Outlook
Cash provided by operating activities $1.2–$1.3
Capital expenditures and proceeds from sale of assets/businesses (0.6)–(0.65)
Free cash flow $0.6–$0.65
The projections above are based on many estimates and are inherently subject to
change based on future decisions made by management and the Board of Directors
of Whirlpool, and significant economic, competitive and other uncertainties and
contingencies.
ONGOING BUSINESS OPERATIONS DILUTED EARNINGS PER SHARE
The reconciliation provided below reconciles the non-GAAP financial measure,
ongoing business operations diluted earnings per share, with the most directly
comparable GAAP financial measure, reported diluted earnings per share, for the
twelve months ended December 31, 2012 and December 31, 2011. For more
information, see document titled “GAAP Reconciliations” at
investors.WhirlpoolCorp.com/annuals.cfm.
Twelve Months
Ended
December 31,
2012 2011
Reported diluted earnings per share $ 5.06 $ 4.99
Restructuring expense 2.15 1.13
Brazilian tax credits (BEFIEX) (0.47) (3.41)
Brazilian collection dispute & antitrust resolutions 0.32 4.85
Investment and intangible impairment 0.12 —
Benefit plan curtailment gain (0.38) (0.28)
Contract and patent resolutions 0.17 —
Supplier quality recovery —(0.49)
Energy Tax Credits ($366 million) —(4.68)
Supplier-related quality issue —(0.06)
Tax rate adjustment 0.08 —
Ongoing business operations diluted earnings per share $ 7.05 $ 2.05
ONGOING BUSINESS OPERATIONS CASH FLOW
The reconciliation provided below reconciles the non-GAAP financial measure, ongo-
ing business operations cash flow, with the most directly comparable GAAP financial
measure, cash provided by operating activities, for the twelve months ended
December 31, 2012 and December 31, 2011. For more information, see document
titled “GAAP Reconciliations” at investors.WhirlpoolCorp.com/annuals.cfm.
(Billions of dollars)
2012 2011
Cash provided by operating activities $ 0.7 $ 0.5
Capital expenditures and proceeds from sale of assets (0.5) (0.6)
Free cash flow $ 0.2 $ (0.1)
Brazilian collection dispute 0.3 0.3
Antitrust resolutions 0.1 0.0
Restructuring cash 0.2 0.1
Brazilian tax credits (0.0) (0.3)
Supplier quality recovery —(0.1)
Contract and patent resolutions 0.0 —
Pension contributions 0.2 0.3
Ongoing business operations cash flow $ 0.9 $ 0.3