Whirlpool 2005 Annual Report Download - page 28
Download and view the complete annual report
Please find page 28 of the 2005 Whirlpool annual report below. You can navigate through the pages in the report by either clicking on the pages listed below, or by using the keyword search tool below to find specific information within the annual report.-
 1
1 -
2
-
3
-
4
-
5
-
6
-
7
-
8
-
9
-
10
-
11
-
12
-
13
-
14
-
15
-
16
-
17
-
 18
18 -
 19
19 -
 20
20 -
 21
21 -
 22
22 -
 23
23 -
 24
24 -
 25
25 -
 26
26 -
 27
27 -
 28
28 -
 29
29 -
 30
30 -
 31
31 -
 32
32 -
 33
33 -
 34
34 -
 35
35 -
 36
36 -
 37
37 -
 38
38 -
39
-
40
-
41
-
42
 |
 |

24 Whirlpool Corporation
Cash Flows
The Consolidated Condensed Statements of Cash Flows reflect
the changes in cash and equivalents for the last three years by
classifying transactions into three major categories: operating,
investing and financing activities.
Operating Activities The Company’s main source of liquidity is
cash generated from operating activities, consisting of net earnings
adjusted for non-cash operating items, such as depreciation, and
changes in operating assets and liabilities such as receivables,
inventories and payables.
The Company’s cash provided by operating activities in 2005
increased $87 million over 2004. Cash provided by operating
activities benefited from lower inventories, reduced pension
contributions, and higher accrued expenses for payroll, incentive
compensation, restructuring and promotional spending. Results
were partially offset by higher accounts receivable balances due
mainly to higher sales and lower payables, primarily a result of
lower inventory levels. Cash flow was also negatively impacted
by a decrease in net taxes payable of $105 million, due, in part, to
a reduction in tax expense. In 2004, cash provided by operating
activities benefited from lower after-tax pension contributions
of approximately $62 million and lower restructuring spending
of approximately $56 million. In 2004, cash flow was negatively
impacted by higher working capital requirements of about $70
million, driven largely by material cost increases and higher
inventory levels to support higher volumes and increased trans-
regional shipments. In 2003, cash provided by operating activities
benefited from higher earnings, primarily within our European
and North American business segments, as well as continued
improvement in working capital management. Cash flow was
negatively impacted by a voluntary after-tax pension contribution
to the Company’s U.S. pension plans of $97 million. The 2003
cash flow was also negatively impacted by restructuring spending,
primarily related to 2002 projects, as well as the timing of
promotional payments.
The Company’s free cash flow was $412 million versus $241
million for the years ended December 31, 2005 and 2004, respectively.
The table that follows reconciles cash provided by operating
activities determined in accordance with accounting principles
generally accepted in the U.S. (“GAAP”) to free cash flow, a non-
GAAP measure. Management believes that free cash flow provides
both management and shareholders with a relevant measure of
liquidity and a useful basis for assessing the Company’s ability to
fund its activities and obligations. There are limitations to using
non-GAAP financial measures, including the difficulty associated
with comparing companies that use similarly named non-GAAP
measures but whose calculations may differ from the Company’s
calculations. As defined by the Company, free cash flow is cash
provided by operating activities after capital expenditures,
proceeds from the sale of business/assets and dividends paid.
The following is a reconciliation of cash provided by operating
activities to free cash flow.
Year Ended December 31 (millions of dollars) 2005 2004
Cash provided by operating activities $ 881 $ 794
Capital expenditures (494) (511)
Proceeds from sale of business / assets 141 74
Dividends paid (116) (116)
Free cash flow $ 412 $ 241
Beginning in 2006, the Company will exclude dividends paid from
the definition of free cash flow.
Investing Activities The principal recurring investing activities are
property additions, which were $494 million, $511 million and $423
million in 2005, 2004 and 2003, respectively. These expenditures are
primarily for equipment and tooling, driven by product innovation
initiatives, more efficient production methods, and replacement for
normal wear and tear. Expenditures are also made to support the
Company’s global operating platform footprint moves to lower cost
locations and replacement, regulatory and infrastructure changes.
In each of 2005, 2004 and 2003, Whirlpool entered into
separate sale-leaseback transactions whereby the Company sold
and leased back certain of its owned properties. Proceeds related
to the sale-leaseback of four properties in 2005, net of related fees,
were approximately $67 million. In 2004, proceeds related to sale-
leasebacks of six properties, net of related fees, were approximately
$66 million. In 2003, proceeds related to the sale-leaseback of four
properties, net of related fees, were approximately $65 million.
Cash proceeds of $48 million resulted from the sale of a non-
core business in Latin America during 2005.
Cash paid in 2005 in connection with the proposed Maytag
acquisition totaled $77 million, primarily consisting of $40 million
to reimburse Maytag for its payment of a fee to terminate its
prior merger agreement with Triton Acquisition Holding Co.
and $37 million in professional fees incurred in connection with
the proposed acquisition. These costs have been capitalized and
are recognized in the other assets line within the Company’s
Consolidated Condensed Balance Sheets. If consummation of the
transaction does not occur, the costs will be reclassified as expense.
On November 18, 2002, the Company acquired the remaining
20% interest in Whirlpool Narcissus Shanghai Company Limited
(“Narcissus”) for $9 million. Subsequent to the purchase, Narcissus
was renamed Whirlpool Home Appliance (Shanghai) Co. Ltd. In
accordance with the purchase agreement, 40% of the purchase
price was paid during 2002, 40% was paid during 2003 and the
remaining 20% was paid during 2004.
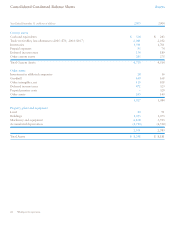
Financial Summary