Vtech 2015 Annual Report Download - page 4
Download and view the complete annual report
Please find page 4 of the 2015 Vtech annual report below. You can navigate through the pages in the report by either clicking on the pages listed below, or by using the keyword search tool below to find specific information within the annual report.-
 1
1 -
 2
2 -
 3
3 -
 4
4 -
 5
5 -
 6
6 -
 7
7 -
 8
8 -
 9
9 -
 10
10 -
 11
11 -
 12
12 -
 13
13 -
 14
14 -
 15
15 -
16
-
17
-
18
-
19
-
20
-
21
-
22
-
23
-
24
-
25
-
26
-
27
-
28
-
29
-
30
-
31
-
32
-
33
-
34
-
35
-
36
-
37
-
38
-
39
-
40
-
41
-
42
-
43
-
44
-
45
-
46
-
47
-
48
-
49
-
50
-
51
-
52
-
53
-
54
-
55
-
56
-
57
-
58
-
59
-
60
-
61
-
62
-
63
-
64
-
65
-
66
-
67
-
68
-
69
-
70
-
71
-
72
-
73
-
74
-
75
-
76
 |
 |

Letter to Shareholders
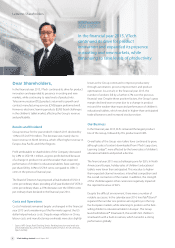
Dear Shareholders,
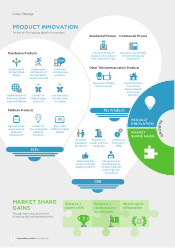
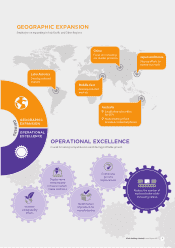
In the financial year 2015, VTech continued its drive for product
innovation and expanded its presence in existing and new
markets, while continuing to raise levels of productivity.
Telecommunication (TEL) prod ucts returned to growth and
contract manufacturing services (CMS) again performed well.
However, electronic learning products (ELPs) faced challenges
in the children’s tablet market, affecting the Group’s revenue
and profitability.
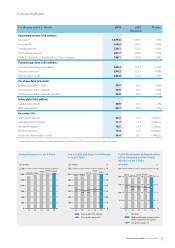
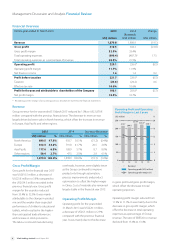
Results and Dividend
Group revenue for the year ended 31 March 2015 declined by
1.0% to US$1,879.8 million. The decrease was mainly due to
lower revenue in North America, which offset higher revenue in
Europe, Asia Pacific and Other Regions.
Profit attributable to shareholders of the Company decreased
by 2.8% to US$198.1 million, as gross profit declined because
of a change in product mix and the weaker-than-expected
performance of children’s educational tablets. Basic earnings
per share fell by 3.0% to US78.9 cents, compared to US81.3
cents in the previous financial year.
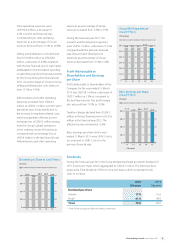
The Board of Directors has proposed a final dividend of US61.0
cents per ordinary share, providing a full-year dividend of US78.0
cents per ordinary share, a 2.5% decrease over the US80.0 cents
per ordinary share declared in the financial year 2014.
Costs and Operations
Cost of materials remained largely unchanged in the financial
year 2015 and a weakening of the Renminbi against the US
dollar helped reduce costs. Despite wage inflation in China,
labour costs and manufacturing overheads were also slightly
lower as the Group continued to improve productivity
through automation, process improvement and product
optimisation. As a result, in the financial year 2015, the
number of workers fell by a further 4.7% over the previous
financial year. Despite these positive factors, the Group’s gross
margin declined year-on-year due to a change in product
mix and the weaker-than-expected performance of children’s
educational tablets, which resulted in higher-than-anticipated
trade allowances and increased stock provision.
Our Business
In the financial year 2015, ELPs remained the largest product
line of the Group, followed by TEL products and CMS.
Overall sales of the Group via e-tailers have continued to grow,
although sales of content downloaded from VTech’s app store,
Learning Lodge™, were affected by the lower sales of children’s
educational tablets and posted a decline.
The financial year 2015 was a challenging one for ELPs. In North
America and Europe, holiday sales of children’s educational
tablets were lower than anticipated. This was due to higher-
than-expected channel inventory, intensified competition and
the overall contraction of the market. In addition, the strength
of the US dollar against other currencies negatively impacted
the reported revenue of ELPs.
Despite the difficult environment, there were a number of
notable successes. In the calendar year 2014, InnoTab®/Storio®
regained the number one position among all toys in the top
five European markets, while retaining its position as the best-
selling children’s educational tablet in Europe1. The Group
launched Kidizoom® Smartwatch, the world’s first children’s
smartwatch with a built-in camera, which turned in a strong
performance globally.
1 Source: NPD Group, Retail Tracking Service. Ranking based on total retail sales
of InnoTab/Storio by unit for the combined market of France, the UK, Germany,
Spain and Italy
In the financial year 2015, VTech
continued its drive for product
innovation and expanded its presence
in existing and new markets, while
continuing to raise levels of productivity.
2 VTech Holdings Limited Annual Report 2015