Vtech 2015 Annual Report Download - page 11
Download and view the complete annual report
Please find page 11 of the 2015 Vtech annual report below. You can navigate through the pages in the report by either clicking on the pages listed below, or by using the keyword search tool below to find specific information within the annual report.-
 1
1 -
 2
2 -
 3
3 -
 4
4 -
 5
5 -
 6
6 -
 7
7 -
 8
8 -
 9
9 -
 10
10 -
 11
11 -
 12
12 -
 13
13 -
 14
14 -
 15
15 -
 16
16 -
 17
17 -
 18
18 -
 19
19 -
 20
20 -
 21
21 -
 22
22 -
23
-
24
-
25
-
26
-
27
-
28
-
29
-
30
-
31
-
32
-
33
-
34
-
35
-
36
-
37
-
38
-
39
-
40
-
41
-
42
-
43
-
44
-
45
-
46
-
47
-
48
-
49
-
50
-
51
-
52
-
53
-
54
-
55
-
56
-
57
-
58
-
59
-
60
-
61
-
62
-
63
-
64
-
65
-
66
-
67
-
68
-
69
-
70
-
71
-
72
-
73
-
74
-
75
-
76
 |
 |

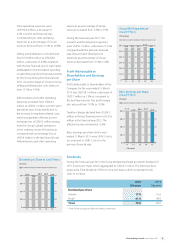
Dividends
During the financial year 2015, the Group declared and paid an interim dividend of
US17.0 cents per share, which aggregated to US$42.7 million. The Directors have
proposed a Final Dividend of US61.0 cents per share, which is estimated to be
US$153.2 million.
2015
US cents
2014
US cents
Dividend per share
Interim 17.0 16.0
Final* 61.0 64.0
Total 78.0 80.0
* Final dividend proposed after the balance sheet date
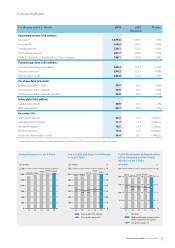
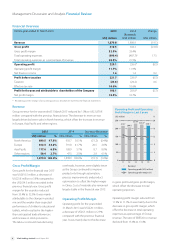
Total operating expenses were
US$390.4 million, a decrease of
4.2% over the last financial year.
Correspondingly, total operating
expenses as a percentage of Group
revenue declined from 21.5% to 20.8%.
Selling and distribution costs declined
from US$286.4 million to US$268.2
million, a decrease of 6.4% compared
with the last financial year. It was mainly
attributable to the decreased spending
on advertising and promotional activities
by the Group during the financial year
2015. As a percentage of Group revenue,
selling and distribution costs reduced
from 15.1% to 14.3%.
Administrative and other operating
expenses increased from US$63.3
million to US$66.1 million over the same
period last year. It was mainly due to
the increase in employee related costs,
which was partially offset by a lower
exchange loss of US$0.3 million arising
from the Group’s global operations
in the ordinary course of business, as
compared with an exchange loss of
US$0.4 million in the last financial year.
Administrative and other operating
expenses as a percentage of Group
revenue increased from 3.3% to 3.5%.
During the financial year 2015, the
research and development expenses
were US$56.1 million, a decrease of 3.3%
compared with the previous financial
year. Research and development
expenses as a percentage of Group
revenue decreased from 3.1% to 3.0%.
Profit Attributable to
Shareholders and Earnings
per Share
Profit attributable to shareholders of the
Company for the year ended 31 March
2015 was US$198.1 million, a decrease of
US$5.7 million or 2.8% as compared to
the last financial year. Net profit margin
also reduced from 10.7% to 10.5%.
Taxation charges declined from US$24.2
million in the last financial year to US$23.6
million in the financial year 2015. The
effective tax rate remained at 10.6%.
Basic earnings per share for the year
ended 31 March 2015 were US78.9 cents
as compared to US81.3 cents in the
previous financial year.
Group R&D Expenditure
in Last 5 Years
US$ million
70
60
50
40
30
20
10
011 12 13 14 15
56.8 57.2 57.1 58.0 56.1
Basic Earnings per Share
in Last 5 Years
US cents
* Restated
100
80
60
40
20
011 12 13 14 15
81.5 77.0 80.6 81.3* 78.9
100
80
60
40
20
011 12 13 14 15
78.0 76.0
80.0 80.0 78.0
Dividend per Share in Last 5 Years
US cents
9VTech Holdings Limited Annual Report 2015