Vtech 2015 Annual Report Download - page 12
Download and view the complete annual report
Please find page 12 of the 2015 Vtech annual report below. You can navigate through the pages in the report by either clicking on the pages listed below, or by using the keyword search tool below to find specific information within the annual report.-
 1
1 -
 2
2 -
 3
3 -
 4
4 -
 5
5 -
 6
6 -
 7
7 -
 8
8 -
 9
9 -
 10
10 -
 11
11 -
 12
12 -
 13
13 -
 14
14 -
 15
15 -
 16
16 -
 17
17 -
 18
18 -
 19
19 -
 20
20 -
 21
21 -
 22
22 -
23
-
24
-
25
-
26
-
27
-
28
-
29
-
30
-
31
-
32
-
33
-
34
-
35
-
36
-
37
-
38
-
39
-
40
-
41
-
42
-
43
-
44
-
45
-
46
-
47
-
48
-
49
-
50
-
51
-
52
-
53
-
54
-
55
-
56
-
57
-
58
-
59
-
60
-
61
-
62
-
63
-
64
-
65
-
66
-
67
-
68
-
69
-
70
-
71
-
72
-
73
-
74
-
75
-
76
 |
 |

Management Discussion and Analysis Financial Review
Liquidity and Financial
Resources
Shareholders’ funds as at 31 March 2015
were US$540.8 million, a decrease of
3.8% from US$562.4 million in the last
financial year. Shareholders’ funds per
share decreased by 4.0% from US$2.24
to US$2.15.
The Group had no borrowings as at
31 March 2014 and 31 March 2015.
The Group’s financial resources remain
strong. As at 31 March 2015, deposits
and cash decreased from US$322.9
million to US$294.2 million, a decrease
of 8.9% compared with the last financial
year-end-date. It was mainly due to the
unfavourable foreign currency exchange
movements on the Group’s net assets
as a result of the depreciation in foreign
currencies against United States Dollar
during the year.
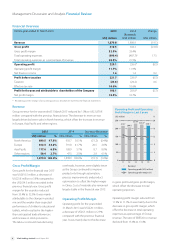
Analysis of Cash Flow from Operations
2015
US$ million
2014
(Restated)
US$ million
Change
US$ million
Operating profit 220.1 226.6 (6.5)
Depreciation and amortisation 31.6 30.8 0.8
EBITDA 251.7 257.4 (5.7)
Gain on disposal of tangible assets (0.2) (0.1) (0.1)
Working capital change (1.1) (0.1) (1.0)
Cash generated from operations 250.4 257.2 (6.8)
The Group’s cash generated from operations for the year ended 31 March 2015 was
US$250.4 million, a decrease of 2.6% as compared to US$257.2 million in the previous
financial year. The reduction was mainly attributable to the decrease in EBITDA in the
financial year 2015 and the higher working capital investment compared with the
previous financial year.
Working Capital Change
Balance as at
31 March 2014
(Restated)
US$ million
Hedging
and others
US$ million
Working
capital
change per
cash flow
US$ million
Balance as at
31 March
2015
US$ million
Stocks 265.9 – 24.3 290.2
Trade debtors 208.6 – 13.3 221.9
Other debtors, deposits
and prepayments 27.2 6.0 4.8 38.0
Trade creditors (140.8) – (45.3) (186.1)
Other creditors
and accruals (163.6) 3.4 3.7 (156.5)
Provisions (27.9) – 0.6 (27.3)
Net obligations on
defined benefit
scheme (2.0) (0.7) (0.3) (3.0)
Total working capital 167.4 8.7 1.1 177.2
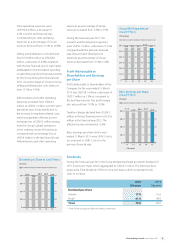
Stocks as of 31 March 2015 were US$290.2 million, increased from US$265.9 million as
of 31 March 2014. The turnover days also increased from 87 days to 96 days. The higher
stock level was primarily to cater for increased demand for the Group’s product in the
first quarter of the financial year 2016. Furthermore, we had arranged early production of
the Group’s products in order to better utilise the Group’s production capacities.
As at 31 March 2015 and 2014
All figures are in US$ million unless stated otherwise 2015 2014
Stocks 290.2 265.9
Average stocks as a percentage of Group revenue 14.8% 14.3%
Turnover days 96 days 87 days
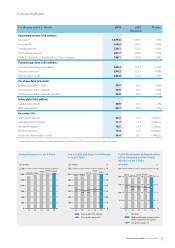
Deposits and Cash in Last 5 Years
(As at 31 March)
US$ million
400
350
300
250
200
100
150
50
011 12 13 14 15
333.1 326.5 308.6 322.9
294.2
10 VTech Holdings Limited Annual Report 2015