Vtech 2015 Annual Report Download - page 13
Download and view the complete annual report
Please find page 13 of the 2015 Vtech annual report below. You can navigate through the pages in the report by either clicking on the pages listed below, or by using the keyword search tool below to find specific information within the annual report.-
 1
1 -
2
-
 3
3 -
 4
4 -
 5
5 -
 6
6 -
 7
7 -
 8
8 -
 9
9 -
 10
10 -
 11
11 -
 12
12 -
 13
13 -
 14
14 -
 15
15 -
 16
16 -
 17
17 -
 18
18 -
 19
19 -
 20
20 -
 21
21 -
 22
22 -
 23
23 -
24
-
25
-
26
-
27
-
28
-
29
-
30
-
31
-
32
-
33
-
34
-
35
-
36
-
37
-
38
-
39
-
40
-
41
-
42
-
43
-
44
-
45
-
46
-
47
-
48
-
49
-
50
-
51
-
52
-
53
-
54
-
55
-
56
-
57
-
58
-
59
-
60
-
61
-
62
-
63
-
64
-
65
-
66
-
67
-
68
-
69
-
70
-
71
-
72
-
73
-
74
-
75
-
76
 |
 |

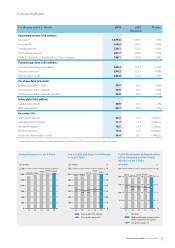
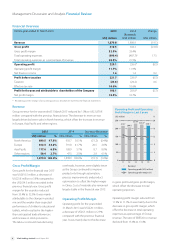
Trade debtors as of 31 March 2015 were US$221.9 million, increased from US$208.6
million as of 31 March 2014. Debtor turnover days also increased from 54 days to
57 days. The higher trade debtor balance as at 31 March 2015 was mainly due to an
increase in revenue in the fourth quarter of the financial year 2015 compared with the
corresponding period of the previous financial year. The Group has tight management
on credit exposure. The overdue balances greater than 30 days accounted for 1.4% of
the gross trade debtors as of 31 March 2015.
As at 31 March 2015 and 2014
All figures are in US$ million unless stated otherwise 2015 2014
Trade debtors 221.9 208.6
Average trade debtors as a percentage of Group revenue 11.5% 11.4%
Turnover days 57 days 54 days
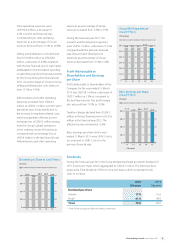
Other debtors, deposits and prepayments as of 31 March 2015 were US$38.0
million, increased from US$27.2 million as of 31 March 2014. It was mainly
attributable to the increase in fair value gain on forward foreign exchange contracts
in the financial year 2015.
Trade creditors as of 31 March 2015 were US$186.1 million, as compared to US$140.8
million as of 31 March 2014. Creditor turnover days also increased from 78 days to 85 days.
As at 31 March 2015 and 2014
All figures are in US$ million unless stated otherwise 2015 2014
Trade creditors 186.1 140.8
Turnover days 85 days 78 days
Other creditors and accruals as of
31 March 2015 were US$156.5 million,
reduced from US$163.6 million as of
31 March 2014. It was largely attributable
to the decrease of fair value losses on
forward foreign exchange contracts
upon settlement and the reduction in
accruals of advertising expenses and
other allowances to customers.
Provisions as of 31 March 2015 were
US$27.3 million, as compared to
US$27.9 million as of 31 March 2014.
Net obligations on defined benefit
scheme as of 31 March 2015 were
US$3.0 million, as compared to US$2.0
million as of 31 March 2014. The increase
was mainly due to the re-measurement
of net liability of defined benefit scheme.
Treasury Policies
The Group’s treasury policies are
designed to mitigate the impact
of fluctuations in foreign currency
exchange rates arising from the Group’s
global operations and to minimise
the Group’s financial risks. The Group
principally uses forward foreign
exchange contracts as appropriate for
risk management purposes only, for
hedging foreign currency transactions
and for managing the Group’s assets
and liabilities. It is the Group’s policy not
to enter into derivative transactions for
speculative purposes.
Capital Expenditure
For the year ended 31 March 2015,
the Group invested US$30.9 million
in the purchase of tangible assets
including machinery and equipment,
leasehold improvements, computer
systems, as well as the improvement of
manufacturing working environment.
All of these capital expenditures were
financed from internal resources.
Capital Commitments and
Contingencies
In the financial year 2016, the Group will
incur capital expenditure of US$34.9
million for ongoing business operations.
All of these capital expenditures will be
financed from internal resources.
As of the financial year end date, the
Group had no material contingencies.
11VTech Holdings Limited Annual Report 2015