Vtech 2015 Annual Report Download - page 17
Download and view the complete annual report
Please find page 17 of the 2015 Vtech annual report below. You can navigate through the pages in the report by either clicking on the pages listed below, or by using the keyword search tool below to find specific information within the annual report.-
 1
1 -
2
-
3
-
4
-
5
-
6
-
 7
7 -
 8
8 -
 9
9 -
 10
10 -
 11
11 -
 12
12 -
 13
13 -
 14
14 -
 15
15 -
 16
16 -
 17
17 -
 18
18 -
 19
19 -
 20
20 -
 21
21 -
 22
22 -
 23
23 -
 24
24 -
 25
25 -
 26
26 -
 27
27 -
28
-
29
-
30
-
31
-
32
-
33
-
34
-
35
-
36
-
37
-
38
-
39
-
40
-
41
-
42
-
43
-
44
-
45
-
46
-
47
-
48
-
49
-
50
-
51
-
52
-
53
-
54
-
55
-
56
-
57
-
58
-
59
-
60
-
61
-
62
-
63
-
64
-
65
-
66
-
67
-
68
-
69
-
70
-
71
-
72
-
73
-
74
-
75
-
76
 |
 |

ASIA PACIFIC
Group revenue in Asia Pacific increased by 8.0% to
US$117.6 million in the financial year 2015, with higher sales
in all three product lines. Asia Pacific accounted for 6.3% of
Group revenue.
Revenue from ELPs in the Asia Pacific increased by 21.6% to
US$25.9 million, on the back of growth in China, Hong Kong
and Korea. The growth in China was driven by the continued
good performance of Switch & Go Dinos, together with
the introduction of Go! Go! Smart Wheels and Kidizoom
Smartwatch. In Hong Kong, growth was seen in all product
categories as the Group increased its sales and marketing
efforts. Further inroads were made in Korea, following the
expansion of the distribution network. Sales in Australia
recorded a decline as VTech completed the transition from
the previous distribution arrangement for ELPs to its own sales
office, positioning itself for future growth.
TEL products revenue increased by 4.6% to US$43.0 million.
Sales growth was recorded in Australia and Japan, the
Group’s major markets in Asia Pacific. Sales in Australia rose as
residential phones and baby monitors recorded higher sales.
For residential phones, VTech increased market share as a result
of gaining more retail shelf space, while baby monitors were
supported by the expansion of distribution channels in the
country. Higher sales were achieved in Japan as a customer
launched new models. The Group also made inroads in
Thailand, Malaysia and Korea.
CMS revenue in Asia Pacific increased by 4.7% to US$48.7 million,
driven by higher sales of wireless products, medical and health
products and solid-state lighting. Sales of wireless products
posted good growth, driven by increased orders of wireless
headsets and the sales contribution from a new customer. Sales
of medical and health products increased, as a customer in Japan
benefited from the weaker Japanese Yen and achieved higher
sales. Growth in solid-state lighting was supported by additional
orders arising from the Youth Olympic Games in Nanjing, China
in the first half of the financial year 2015.
OTHER REGIONS
Group revenue in Other Regions, namely Latin America, the
Middle East and Africa, rose by 6.1% to US$50.4 million in
the financial year 2015. Other Regions accounted for 2.7% of
Group revenue.
ELPs revenue in Other Regions increased by 10.4% to
US$14.8 million, as a sales decline in the Middle East was offset
by higher sales in Latin America and Africa.
TEL products revenue in Other Regions increased by 6.7% to
US$35.1 million, with higher sales in Latin America, the Middle
East and Africa.
CMS revenue in Other Regions was US$0.5 million in the
financial year 2015, as compared to US$1.2 million in the
previous financial year.
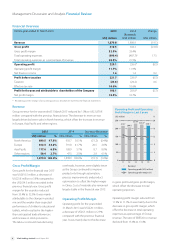
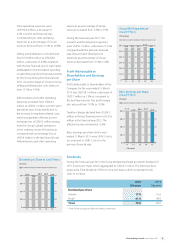
Revenue in Asia Pacic in Last 5 Years
US$ million
120
90
60
30
011 12 13 14 15
98.2 94.1 99.8
108.9
117.6
Revenue in Other Regions in Last 5 Years
US$ million
80
60
40
20
011 12 13 14 15
72.1 67.6
54.9
47.5 50.4
15VTech Holdings Limited Annual Report 2015