Vtech 2015 Annual Report Download - page 14
Download and view the complete annual report
Please find page 14 of the 2015 Vtech annual report below. You can navigate through the pages in the report by either clicking on the pages listed below, or by using the keyword search tool below to find specific information within the annual report.-
 1
1 -
2
-
3
-
 4
4 -
 5
5 -
 6
6 -
 7
7 -
 8
8 -
 9
9 -
 10
10 -
 11
11 -
 12
12 -
 13
13 -
 14
14 -
 15
15 -
 16
16 -
 17
17 -
 18
18 -
 19
19 -
 20
20 -
 21
21 -
 22
22 -
 23
23 -
 24
24 -
25
-
26
-
27
-
28
-
29
-
30
-
31
-
32
-
33
-
34
-
35
-
36
-
37
-
38
-
39
-
40
-
41
-
42
-
43
-
44
-
45
-
46
-
47
-
48
-
49
-
50
-
51
-
52
-
53
-
54
-
55
-
56
-
57
-
58
-
59
-
60
-
61
-
62
-
63
-
64
-
65
-
66
-
67
-
68
-
69
-
70
-
71
-
72
-
73
-
74
-
75
-
76
 |
 |

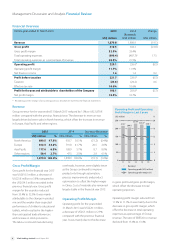
Management Discussion and Analysis Review of Operations
GROUP REVENUE BY REGION
NORTH AMERICA
47.8 %
US$899.5 million
(-5.4% year-on-year)
EUROPE
43.2 %
US$812.3 million
(+2.6% year-on-year)
OTHER REGIONS
2.7 %
US$50.4 million
+6.1% year-on-year
ASIA PACIFIC
6.3 %
US$117.6 million
+8.0% year-on-year
12 VTech Holdings Limited Annual Report 2015