Vtech 2015 Annual Report Download - page 10
Download and view the complete annual report
Please find page 10 of the 2015 Vtech annual report below. You can navigate through the pages in the report by either clicking on the pages listed below, or by using the keyword search tool below to find specific information within the annual report.-
 1
1 -
 2
2 -
 3
3 -
 4
4 -
 5
5 -
 6
6 -
 7
7 -
 8
8 -
 9
9 -
 10
10 -
 11
11 -
 12
12 -
 13
13 -
 14
14 -
 15
15 -
 16
16 -
 17
17 -
 18
18 -
 19
19 -
 20
20 -
 21
21 -
22
-
23
-
24
-
25
-
26
-
27
-
28
-
29
-
30
-
31
-
32
-
33
-
34
-
35
-
36
-
37
-
38
-
39
-
40
-
41
-
42
-
43
-
44
-
45
-
46
-
47
-
48
-
49
-
50
-
51
-
52
-
53
-
54
-
55
-
56
-
57
-
58
-
59
-
60
-
61
-
62
-
63
-
64
-
65
-
66
-
67
-
68
-
69
-
70
-
71
-
72
-
73
-
74
-
75
-
76
 |
 |

Management Discussion and Analysis Financial Review
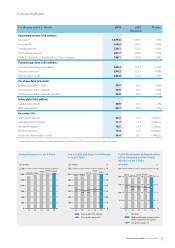
Financial Overview
For the year ended 31 March 2015 2015
US$ million
2014
(Restated)
US$ million
Change
US$ million
Revenue 1,879.8 1,898.9 (19.1)
Gross profit 610.5 634.3 (23.8)
Gross profit margin 32.5% 33.4%
Total operating expenses (390.4) (407.7)* 17.3
Total operating expenses as a percentage of revenue 20.8% 21.5%
Operating profit 220.1 226.6* (6.5)
Operating profit margin 11.7% 11.9%
Net finance income 1.6 1.4 0.2
Profit before taxation 221.7 228.0* (6.3)
Taxation (23.6) (24.2) 0.6
Effective tax rate 10.6% 10.6%
Profit for the year and attributable to shareholders of the Company 198.1 203.8* (5.7)
Net profit margin 10.5% 10.7%
* Restated upon the change of accounting policy as described in note B to the financial statements
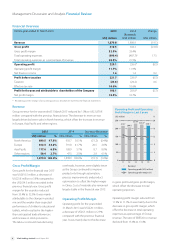
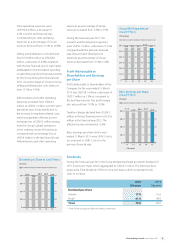
Revenue
Group revenue for the year ended 31 March 2015 reduced by 1.0% to US$1,879.8
million compared with the previous financial year. The decrease in revenue was
largely driven by lower sales in North America, which offset the increase in revenue
in Europe, Asia Pacific and other regions.
2015 2014 Increase/(decrease)
US$ million % US$ million % US$ million %
North America 899.5 47.8% 950.7 50.1% (51.2) (5.4%)
Europe 812.3 43.2% 791.8 41.7% 20.5 2.6%
Asia Pacific 117.6 6.3% 108.9 5.7% 8.7 8.0%
Other regions 50.4 2.7% 47.5 2.5% 2.9 6.1%
1,879.8 100.0% 1,898.9 100.0% (19.1) (1.0%)
Gross Profit/Margin
Gross profit for the financial year 2015
was US$610.5 million, a decrease of
US$23.8 million or 3.8% compared to
the US$634.3 million recorded in the
previous financial year. Gross profit
margin for the year also reduced
from 33.4% to 32.5%. It was mainly
attributable to the change in product
mix and the weaker-than-expected
performance of children’s educational
tablets, which resulted in the higher-
than-anticipated trade allowances
and increase in stock provisions.
The labour costs and manufacturing
overheads, however, were slightly lower
as the Group continued to improve
productivity through automation,
process improvements and product
optimisation to offset the higher wages
in China. Cost of materials also remained
largely stable in the financial year 2015.
Operating Profit/Margin
Operating profit for the year ended
31 March 2015 was US$220.1 million,
a decrease of US$6.5 million or 2.9%
compared with the previous financial
year. It was mainly due to the decrease
in gross profit and gross profit margin,
which offset the decrease in total
operating expenses.
Operating profit margin reduced from
11.9% to 11.7%. It was mainly due to the
decrease in gross profit margin, which
offset the decrease in total operating
expenses as a percentage of Group
revenue. The ratio of EBITDA to revenue
declined from 13.6% to 13.4%.
Operating Prot and Operating
Prot Margin in Last 5 years
US$ million
*Restated
Operating prot (US$ million)
Operating prot margin (%)
250
200
150
100
50
011 12 13 14 15
218.7 209.5
223.9 226.6* 220.1
20
16
12
8
4
0
%
12.8
11.7 12.0 11.9 11.7
8 VTech Holdings Limited Annual Report 2015