Vtech 2015 Annual Report Download - page 3
Download and view the complete annual report
Please find page 3 of the 2015 Vtech annual report below. You can navigate through the pages in the report by either clicking on the pages listed below, or by using the keyword search tool below to find specific information within the annual report.-
 1
1 -
 2
2 -
 3
3 -
 4
4 -
 5
5 -
 6
6 -
 7
7 -
 8
8 -
 9
9 -
 10
10 -
 11
11 -
 12
12 -
 13
13 -
 14
14 -
15
-
16
-
17
-
18
-
19
-
20
-
21
-
22
-
23
-
24
-
25
-
26
-
27
-
28
-
29
-
30
-
31
-
32
-
33
-
34
-
35
-
36
-
37
-
38
-
39
-
40
-
41
-
42
-
43
-
44
-
45
-
46
-
47
-
48
-
49
-
50
-
51
-
52
-
53
-
54
-
55
-
56
-
57
-
58
-
59
-
60
-
61
-
62
-
63
-
64
-
65
-
66
-
67
-
68
-
69
-
70
-
71
-
72
-
73
-
74
-
75
-
76
 |
 |

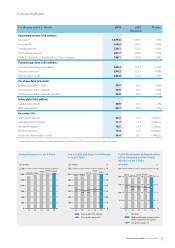
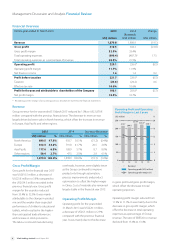
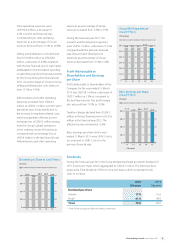
Financial Highlights
For the year ended 31 March 2015 2014
(Restated)
Change
Operating results (US$ million)
Revenue 1,879.8 1,898.9 -1.0%
Gross profit 610.5 634.3 -3.8%
Operating profit 220.1 226.6 -2.9%
Profit before taxation 221.7 228.0 -2.8%
Profit attributable to shareholders of the Company 198.1 203.8 -2.8%
Financial position (US$ million)
Cash generated from operations 250.4 257.2 -2.6%
Deposits and cash 294.2 322.9 -8.9%
Shareholders’ funds 540.8 562.4 -3.8%
Per share data (US cents)
Earnings per share – basic 78.9 81.3 -3.0%
Earnings per share – diluted 78.9 81.3 -3.0%
Dividend per share – interim and final 78.0 80.0 -2.5%
Other data (US$ million)
Capital expenditure 30.9 30.1 2.7%
R&D expenditure 56.1 58.0 -3.3%
Key ratios (%)
Gross profit margin 32.5 33.4 -0.9% pts
Operating profit margin 11.7 11.9 -0.2% pts
Net profit margin* 10.5 10.7 -0.2% pts
EBITDA/Revenue 13.4 13.6 -0.2% pts
Return on shareholders’ funds 36.6 36.2 0.4% pts
* Net profit margin is calculated as profit attributable to shareholders of the Company as a percentage of revenue
Prot Attributable to Shareholders
of the Company and Net Prot
Margin in Last 5 Years
US$ million
*Restated
Prot attributable to shareholder
s
of the Company (US$ million)
Net prot margin (%)
250
200
150
100
50
011 12 13 14 15
202.0 191.9 201.5 203.8* 198.1
20
16
12
8
4
0
%
11.8
10.8 10.8 10.7 10.5
Gross Prot and Gross Prot Margin
in Last 5 Years
US$ million
Gross prot (US$ million)
Gross prot margin (%)
700
600
500
400
300
200
100
011 12 13 14 15
566.9 570.8
597.8
634.3 610.5
70
60
50
40
30
20
10
0
%
33.1 32.0 32.2 33.4 32.5
Group Revenue in Last 5 Years
US$ million
2,100
1,800
1,500
1,200
900
600
300
011 12 13 14 15
1,712.8 1,784.5 1,858.0 1,898.9 1,879.8
1VTech Holdings Limited Annual Report 2015