Vodafone 1999 Annual Report Download - page 19
Download and view the complete annual report
Please find page 19 of the 1999 Vodafone annual report below. You can navigate through the pages in the report by either clicking on the pages listed below, or by using the keyword search tool below to find specific information within the annual report.-
 1
1 -
2
-
3
-
4
-
5
-
6
-
7
-
8
-
 9
9 -
 10
10 -
 11
11 -
 12
12 -
 13
13 -
 14
14 -
 15
15 -
 16
16 -
 17
17 -
 18
18 -
 19
19 -
 20
20 -
 21
21 -
 22
22 -
 23
23 -
 24
24 -
 25
25 -
 26
26 -
 27
27 -
 28
28 -
 29
29 -
30
-
31
-
32
-
33
-
34
-
35
-
36
-
37
-
38
-
39
-
40
-
41
-
42
-
43
-
44
-
45
-
46
-
47
-
48
-
49
-
50
-
51
-
52
-
53
-
54
-
55
-
56
-
57
-
58
-
59
-
60
-
61
-
62
-
63
-
64
-
65
-
66
-
67
-
68
-
69
-
70
-
71
-
72
-
73
-
74
-
75
-
76
-
77
 |
 |

Financial Review
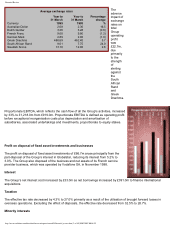
The increase in the minority interests in profit on ordinary activities after taxation is primarily due to the impact of the
increased profits arising in the Group’s 55% owned Greek subsidiary, Panafon.
BACK TO TOP
Future results
There are many factors that will influence the Group’s future performance, the most significant of these being the
proposed merger with AirTouch.
In respect of the Group’s continuing operations, factors affecting future turnover and profit performance are the potential
for growth of the mobile telecommunications markets, the Group’s market share, revenue per customer, the costs of
providing and selling existing services and start up costs of new businesses.
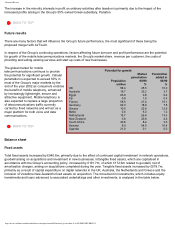
Potential for growth
Market
penetration
Penetration
added in
Population 98/99 98/99
million % %
UK 58.4 25.5 10.0
Australia 18.7 32.2 3.7
Egypt 63.0 0.6 0.4
Fiji 0.8 1.0 0.4
France 58.6 21.4 10.1
Germany 82.3 18.8 7.5
Greece 10.5 22.8 12.6
Malta 0.4 6.3 1.2
Netherlands 15.7 26.4 13.4
New Zealand 3.8 20.8 4.0
South Africa 40.6 8.2 3.6
Sweden 8.9 54.0 16.4
Uganda 21.0 0.1 0.0
The global market for mobile
telecommunications continues to provide
the potential for significant growth. Cellular
penetration is expected to exceed 50% in
most of the Group’s major markets by the
end of the year 2002 as consumers endorse
the benefit of mobile telephony, enhanced
by increasingly lightweight, secure and
attractive equipment. Mobile telephony is
also expected to replace a large proportion
of telecommunications traffic currently
carried by fixed networks and will act as a
major platform for both voice and data
communications.
BACK TO TOP
Balance sheet
Fixed assets
Total fixed assets increased by £940.6m, primarily due to the effect of continued capital investment in network operations,
goodwill arising on acquisitions and investment in new businesses. Intangible fixed assets, which are capitalised in
accordance with the Group’s accounting policy, increased by £191.7m, of which £172.6m related to goodwill, net of
amortisation charges, arising on acquisitions completed during the year. Tangible fixed assets increased by £578.7m,
primarily as a result of capital expenditure on digital networks in the UK, Australia, the Netherlands and Greece and the
inclusion of Vodafone New Zealand’s fixed assets on acquisition. The movement in investments, which includes equity
investments and loans advanced to associated undertakings and other investments, is analysed in the table below.
http://www.vodafone.com/download/investor/reports/annual99/financial_review.htm (4 of 10)30/03/2007 00:08:22