United Healthcare 2007 Annual Report Download - page 87
Download and view the complete annual report
Please find page 87 of the 2007 United Healthcare annual report below. You can navigate through the pages in the report by either clicking on the pages listed below, or by using the keyword search tool below to find specific information within the annual report.-
 1
1 -
2
-
3
-
4
-
5
-
6
-
7
-
8
-
9
-
10
-
11
-
12
-
13
-
14
-
15
-
16
-
17
-
18
-
19
-
20
-
21
-
22
-
23
-
24
-
25
-
26
-
27
-
28
-
29
-
30
-
31
-
32
-
33
-
34
-
35
-
36
-
37
-
38
-
39
-
40
-
41
-
42
-
43
-
44
-
45
-
46
-
47
-
48
-
49
-
50
-
51
-
52
-
53
-
54
-
55
-
56
-
57
-
58
-
59
-
60
-
61
-
62
-
63
-
64
-
65
-
66
-
67
-
68
-
69
-
70
-
71
-
72
-
73
-
74
-
75
-
76
-
 77
77 -
 78
78 -
 79
79 -
 80
80 -
 81
81 -
 82
82 -
 83
83 -
 84
84 -
 85
85 -
 86
86 -
 87
87 -
 88
88 -
 89
89 -
 90
90 -
 91
91 -
 92
92 -
 93
93 -
 94
94 -
 95
95 -
 96
96 -
 97
97 -
98
-
99
-
100
-
101
-
102
-
103
-
104
-
105
-
106
 |
 |

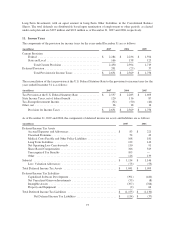
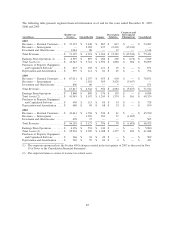
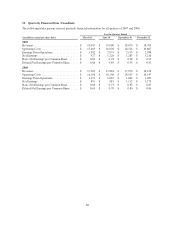
The following table presents segment financial information as of and for the years ended December 31, 2007,
2006 and 2005:
(in millions)
Health Care
Services OptumHealth Ingenix
Prescription
Solutions
Corporate and
Intersegment
Eliminations Consolidated
2007
Revenues — External Customers . . . $ 70,155 $ 2,448 $ 867 $ 817 $ — $ 74,287
Revenues — Intersegment ........ — 2,385 437 12,420 (15,242) —
Investment and Other Income ..... 1,044 88 — 12 — 1,144
Total Revenues ................. $ 71,199 $ 4,921 $ 1,304 $ 13,249 $ (15,242) $ 75,431
Earnings From Operations (1) ..... $ 6,595 $ 895 $ 266 $ 269 $ (176) $ 7,849
Total Assets (2) ................. $ 43,343 $ 3,714 $ 1,596 $ 1,860 $ 386 $ 50,899
Purchases of Property, Equipment
and Capitalized Software ....... $ 623 $ 108 $ 121 $ 19 $ — $ 871
Depreciation and Amortization .... $ 559 $ 111 $ 81 $ 45 $ — $ 796
2006
Revenues — External Customers . . . $ 67,011 $ 2,357 $ 653 $ 650 $ — $ 70,671
Revenues — Intersegment ........ — 1,925 303 3,429 (5,657) —
Investment and Other Income ..... 806 60 — 5 — 871
Total Revenues ................. $ 67,817 $ 4,342 $ 956 $ 4,084 $ (5,657) $ 71,542
Earnings From Operations ........ $ 5,860 $ 809 $ 176 $ 139 $ — $ 6,984
Total Assets (2) ................. $ 41,949 $ 3,187 $ 1,249 $ 1,374 $ 561 $ 48,320
Purchases of Property, Equipment
and Capitalized Software ....... $ 496 $ 113 $ 85 $ 34 $ — $ 728
Depreciation and Amortization .... $ 480 $ 89 $ 68 $ 33 $ — $ 670
2005
Revenues — External Customers . . . $ 43,641 $ 1,704 $ 534 $ 41 $ — $ 45,920
Revenues — Intersegment ........ — 1,396 262 37 (1,695) —
Investment and Other Income ..... 478 27 — — — 505
Total Revenues ................. $ 44,119 $ 3,127 $ 796 $ 78 $ (1,695) $ 46,425
Earnings From Operations ........ $ 4,376 $ 574 $ 130 $ — $ — $ 5,080
Total Assets (2) ................. $ 35,994 $ 2,239 $ 1,048 $ 1,357 $ 650 $ 41,288
Purchases of Property, Equipment
and Capitalized Software ....... $ 366 $ 94 $ 49 $ — $ — $ 509
Depreciation and Amortization .... $ 330 $ 59 $ 62 $ 2 $ — $ 453
(1) The corporate amount reflects the Section 409A charge recorded in the first quarter of 2007 as discussed in Note
10 of Notes to the Consolidated Financial Statements.
(2) The corporate balances consist of income tax-related assets.
85