United Healthcare 2007 Annual Report Download - page 69
Download and view the complete annual report
Please find page 69 of the 2007 United Healthcare annual report below. You can navigate through the pages in the report by either clicking on the pages listed below, or by using the keyword search tool below to find specific information within the annual report.-
 1
1 -
2
-
3
-
4
-
5
-
6
-
7
-
8
-
9
-
10
-
11
-
12
-
13
-
14
-
15
-
16
-
17
-
18
-
19
-
20
-
21
-
22
-
23
-
24
-
25
-
26
-
27
-
28
-
29
-
30
-
31
-
32
-
33
-
34
-
35
-
36
-
37
-
38
-
39
-
40
-
41
-
42
-
43
-
44
-
45
-
46
-
47
-
48
-
49
-
50
-
51
-
52
-
53
-
54
-
55
-
56
-
57
-
58
-
 59
59 -
 60
60 -
 61
61 -
 62
62 -
 63
63 -
 64
64 -
 65
65 -
 66
66 -
 67
67 -
 68
68 -
 69
69 -
 70
70 -
 71
71 -
 72
72 -
 73
73 -
 74
74 -
 75
75 -
 76
76 -
 77
77 -
 78
78 -
 79
79 -
80
-
81
-
82
-
83
-
84
-
85
-
86
-
87
-
88
-
89
-
90
-
91
-
92
-
93
-
94
-
95
-
96
-
97
-
98
-
99
-
100
-
101
-
102
-
103
-
104
-
105
-
106
 |
 |

becomes known or when we do not anticipate holding the investment until recovery. If any of our investments
experience a decline in fair value that is determined to be other-than-temporary, based on analysis of relevant
factors, we record a realized loss in our Consolidated Statements of Operations. We do not consider the
unrealized losses on each of the investments described above to be other-than-temporarily impaired at
December 31, 2007.
We recorded realized gains and losses on sales of investments, as follows:
For the Year Ended
December 31,
(in millions) 2007 2006 2005
Gross Realized Gains ........................................... $ 57 $ 41 $ 60
Gross Realized Losses ........................................... (19) (37) (50)
Net Realized Gains ......................................... $ 38 $ 4 $ 10
Included in the realized losses above are impairment charges of $6 million, $4 million and $8 million for 2007,
2006 and 2005, respectively.
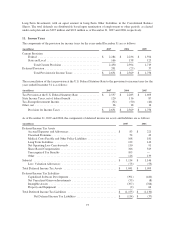
6. Goodwill and Other Intangible Assets
Changes in the carrying amount of goodwill, by segment, during the years ended December 31, 2007 and 2006,
were as follows:
(in millions)
Health
Care
Services OptumHealth Ingenix
Prescription
Solutions Consolidated
Balance at December 31, 2005 ...... $ 14,105 $ 742 $ 715 $ 676 $ 16,238
Acquisitions and Subsequent
Payments/Adjustments .......... 161 331 92 — 584
Balance at December 31, 2006 ...... $ 14,266 $ 1,073 $ 807 $ 676 $ 16,822
Acquisitions and Subsequent
Payments/Adjustments .......... (127) 7 151 1 32
Balance at December 31, 2007 ...... $ 14,139 $ 1,080 $ 958 $ 677 $ 16,854
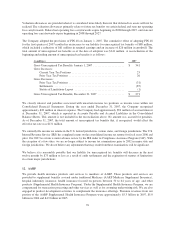
The gross carrying value, accumulated amortization and net carrying value of other intangible assets as of
December 31, 2007 and 2006, were as follows:
December 31, 2007 December 31, 2006
(in millions)
Gross
Carrying
Value
Accumulated
Amortization
Net
Carrying
Value
Gross
Carrying
Value
Accumulated
Amortization
Net
Carrying
Value
Customer Contracts and Membership
Lists ............................$ 1,879 $ (394) $ 1,485 $ 1,871 $ (246) $ 1,625
Patents, Trademarks and Technology .... 302 (121) 181 303 (89) 214
Other ............................. 109 (38) 71 103 (38) 65
Total .........................$ 2,290 $ (553) $ 1,737 $ 2,277 $ (373) $ 1,904
Amortization expense relating to intangible assets was $192 million in 2007, $181 million in 2006 and $94
million in 2005. Estimated full year amortization expense relating to intangible assets for each of the next five
years is as follows: $185 million in 2008, $167 million in 2009, $158 million in 2010, $153 million in 2011, and
$151 million in 2012.
67