United Healthcare 2007 Annual Report Download - page 19
Download and view the complete annual report
Please find page 19 of the 2007 United Healthcare annual report below. You can navigate through the pages in the report by either clicking on the pages listed below, or by using the keyword search tool below to find specific information within the annual report.-
 1
1 -
2
-
3
-
4
-
5
-
6
-
7
-
8
-
 9
9 -
 10
10 -
 11
11 -
 12
12 -
 13
13 -
 14
14 -
 15
15 -
 16
16 -
 17
17 -
 18
18 -
 19
19 -
 20
20 -
 21
21 -
 22
22 -
 23
23 -
 24
24 -
 25
25 -
 26
26 -
 27
27 -
 28
28 -
 29
29 -
30
-
31
-
32
-
33
-
34
-
35
-
36
-
37
-
38
-
39
-
40
-
41
-
42
-
43
-
44
-
45
-
46
-
47
-
48
-
49
-
50
-
51
-
52
-
53
-
54
-
55
-
56
-
57
-
58
-
59
-
60
-
61
-
62
-
63
-
64
-
65
-
66
-
67
-
68
-
69
-
70
-
71
-
72
-
73
-
74
-
75
-
76
-
77
-
78
-
79
-
80
-
81
-
82
-
83
-
84
-
85
-
86
-
87
-
88
-
89
-
90
-
91
-
92
-
93
-
94
-
95
-
96
-
97
-
98
-
99
-
100
-
101
-
102
-
103
-
104
-
105
-
106
 |
 |
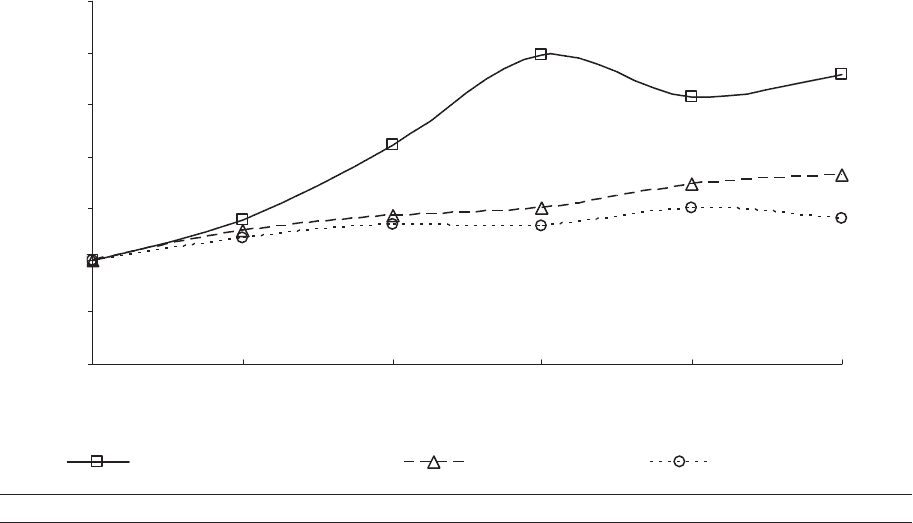
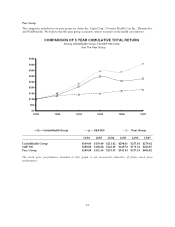
COMPARISON OF 5 YEAR CUMULATIVE TOTAL RETURN
Among UnitedHealth Group, The S&P 500 Index
And The Fortune 50 Group
$0
$50
$100
$150
$200
$250
$300
$350
UnitedHealth Group S&P 500 Fortune 50 Group
12/02 12/0412/03 12/05 12/06 12/07
12/02 12/03 12/04 12/05 12/06 12/07
UnitedHealth Group $100.00 $139.40 $211.02 $298.01 $257.81 $279.42
S&P 500 $100.00 $128.68 $142.69 $149.70 $173.34 $182.87
Fortune 50 Group $100.00 $121.48 $134.20 $132.92 $150.72 $140.95
The stock price performance included in this graph is not necessarily indicative of future stock price
performance.
17