United Healthcare 2007 Annual Report Download - page 58
Download and view the complete annual report
Please find page 58 of the 2007 United Healthcare annual report below. You can navigate through the pages in the report by either clicking on the pages listed below, or by using the keyword search tool below to find specific information within the annual report.-
 1
1 -
2
-
3
-
4
-
5
-
6
-
7
-
8
-
9
-
10
-
11
-
12
-
13
-
14
-
15
-
16
-
17
-
18
-
19
-
20
-
21
-
22
-
23
-
24
-
25
-
26
-
27
-
28
-
29
-
30
-
31
-
32
-
33
-
34
-
35
-
36
-
37
-
38
-
39
-
40
-
41
-
42
-
43
-
44
-
45
-
46
-
47
-
 48
48 -
 49
49 -
 50
50 -
 51
51 -
 52
52 -
 53
53 -
 54
54 -
 55
55 -
 56
56 -
 57
57 -
 58
58 -
 59
59 -
 60
60 -
 61
61 -
 62
62 -
 63
63 -
 64
64 -
 65
65 -
 66
66 -
 67
67 -
 68
68 -
69
-
70
-
71
-
72
-
73
-
74
-
75
-
76
-
77
-
78
-
79
-
80
-
81
-
82
-
83
-
84
-
85
-
86
-
87
-
88
-
89
-
90
-
91
-
92
-
93
-
94
-
95
-
96
-
97
-
98
-
99
-
100
-
101
-
102
-
103
-
104
-
105
-
106
 |
 |
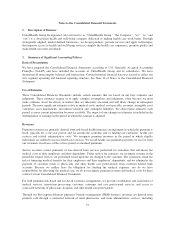
claims processing and formulary design and management. Product revenues include ingredient costs (net of
rebates), a negotiated dispensing fee and customer co-payments for drugs dispensed through our mail-service
pharmacy. In all retail pharmacy transactions, revenues recognized always exclude the member’s applicable
co-payment. Product revenues are recognized upon sale or shipment. Service revenues are recognized when the
prescription claim is adjudicated. The Company has entered into retail service contracts that separately obligate us
to pay our network pharmacy providers for benefits provided to its customers, whether or not we are paid. We are
also involved in establishing the prices charged by retail pharmacies, determining which drugs will be included in
formulary listings and selecting which retail pharmacies will be included in the network offered to plan sponsors’
members. As a result, revenues are reported on a gross basis in accordance with Emerging Issues Task Force (EITF)
Issue No. 99-19, “Reporting Gross Revenue as a Principal versus Net as an Agent.” Product revenues also include
sales of Ingenix syndicated content products which are recognized as revenue upon shipment.
Medical Costs and Medical Costs Payable
Medical costs and medical costs payable include estimates of our obligations for medical care services that have
been rendered on behalf of insured consumers but for which we have either not yet received or processed claims,
and for liabilities for physician, hospital and other medical cost disputes. We develop estimates for medical costs
incurred but not reported using an actuarial process that is consistently applied, centrally controlled and
automated. The actuarial models consider factors such as time from date of service to claim receipt, claim
backlogs, care professional contract rate changes, medical care consumption and other medical cost trends. We
estimate liabilities for physician, hospital and other medical cost disputes based upon an analysis of potential
outcomes, assuming a combination of litigation and settlement strategies. Each period, we re-examine previously
established medical costs payable estimates based on actual claim submissions and other changes in facts and
circumstances. As the liability estimates recorded in prior periods become more exact, we adjust the amount of
the estimates, and include the changes in estimates in medical costs in the period in which the change is
identified. In every reporting period, our operating results include the effects of more completely developed
medical costs payable estimates associated with previously reported periods.
Cash, Cash Equivalents and Investments
Cash and cash equivalents are highly liquid investments that generally have an original maturity of three months
or less. The fair value of cash and cash equivalents approximates their carrying value because of the short
maturity of the instruments. Investments with maturities of less than one year are classified as short-term. We
may sell investments classified as long-term before their maturities to fund working capital or for other purposes.
Because of regulatory requirements, certain investments are included in long-term investments regardless of their
maturity date. We classify these investments as held-to-maturity and report them at amortized cost. All other
investments are classified as available for sale and reported at fair value based on quoted market prices.
We exclude unrealized gains and losses on investments available for sale from earnings and report them, net of
income tax effects, as a separate component of shareholders’ equity. We continually monitor the difference
between the cost and estimated fair value of our investments. For those investments in an unrealized loss
position, we analyze relevant factors individually and in combination including the length of time and extent to
which market value has been less than cost, the financial condition and near-term prospects of the issuer as well
as specific events or circumstances that may influence the operations of the issuer, and our intent and ability to
hold the investment for a sufficient time to recover our cost. New information and the passage of time can change
these judgments. We revise impairment judgments when new information becomes known or when we do not
anticipate holding the investment until the forecasted recovery. If any of our investments experience a decline in
value that is determined to be other than temporary, based on analysis of relevant factors, we record a realized
loss in Investment and Other Income in our Consolidated Statements of Operations. We manage our investment
portfolio to limit our exposure to any one issuer or industry and largely limit our investments to U.S. Government
and Agency securities, state and municipal securities, and corporate debt obligations that are investment grade.
To calculate realized gains and losses on the sale of investments, we use the specific cost or amortized cost of
each investment sold.
56